
Analysis of Isotopic Abundance Ratio of Consciousness Energy Healing Treated Silver SulfadiazineUsing LC-MSand GC-MS Spectrometry
Alice Branton1, Mahendra Kumar Trivedi1, Dahryn Trivedi1, Snehasis Jana2*
Affiliation
1Trivedi Global, Inc., Henderson, Nevada, USA
2Trivedi Science Research Laboratory Pvt. Ltd., Thane-West, Maharashtra, India
Corresponding Author
Dr. Snehasis Jana, Trivedi Science Research Laboratory Pvt. Ltd., Thane-West, Maharashtra, India; E-mail: publication@trivedisrl.com
Citation
Branton, A., et al. Analysis of Isotopic Abundance Ratio of Consciousness Energy Healing Treated Silver Sulfadiazine Using LC-MS and GC-MS Spectrometry. (2020) J Anal Bioanal Separation Tech 4(1): 1-7.
Copy rights
© 2020 Branton A. This is an Open access article distributed under the terms of Creative Commons Attribution 4.0 International License.
Keywords
Silver sulfadiazine; The Trivedi Effect®; Biofield Energy; Consciousness Energy Healing Treatment; LC-MS; GC-MS
Abstract
Silver sulfadiazine is a sulfonamide-based topical antibiotic used in the partial and full burn to prevent infection. This study was performed to investigate the impact of The Trivedi Effect®-Biofield Energy Healing Treatment on the structural properties and the isotopic abundance ratio of silver sulfadiazine using LC-MS and GC-MS spectroscopy. Silver sulfadiazine sample was divided into two parts, one part of silver sulfadiazine was considered as control (no Biofield Energy Treatment was provided), while the second part was treated with The Trivedi Effect®-Consciousness Energy Healing Treatment remotely by a renowned Biofield Energy Healer, Alice Branton and termed as a treated sample. The LC-MS spectra of both the control and Biofield Energy Treated samples at retention time (Rt) 4.1 minutes exhibited the mass of the protonated molecular ion peak at m/z 251.08 (calculated for C10H11N4O2S+, 251.06) with 100% base peak intensity in the MS spectrum in +ve ion mode was found to be sulfadiazine. The LC-MS based isotopic abundance ratio of PM+1/PM in the treated sulfadiazine was significantly increased by 59.03% compared with the control sample. Thus, 13C, 2H, 15N, 17O, and 33S contributions from (C10H11N4O2S)+ to m/z 252.08 in the treated sample were significantly increased compared with the control sample. The control and treated silver sulfadiazine showed the presence of the chromatographic peak at the retention time of 17.71 min in the GC-MS chromatograms. The GC-MS based isotopic abundance ratio of PM+1/PM and PM+2/PM in the treated sulfadiazine was significantly decreased by 3% and 22.04%, respectively compared with the control sample. Hence, 13C, 2H, 15N, 17O, 33 S, and 34S contributions from (C7H9N2O2S)+ to m/z 186 and 187 in the Biofield Energy Treated sample were significantly decreased compared with the control sample. The isotopic abundance ratios of PM+1/PM (2H/1H or 13C/12C or 15N/14N or 17O/16O or 33S/32S) and PM+2/PM (34S/32S) in the treated silver sulfadiazine were significantly decreased compared to the control sample. It can be assumed that the changes in isotopic abundance and mass peak intensities could be due to changes in nuclei possibly via the interference of neutrino particles controlled by The Trivedi Effect® - Consciousness Energy Healing Treatment. The new form of silver sulfadiazine would be better for designing novel pharmaceutical formulations that might offer better therapeutic response against bacterial infections, superficial and partial thickness burn injuries, etc.
Introduction
Silver sulfadiazine is a sulfonamide-based topical antibiotic used in the partial and full burn to prevent infection. It has the antibacterial and antifungal properties, act through a combined activity of silver and sulfadiazine[1]. The mode of action involves that, the sodium chloride-in the body fluids interact with silver sulfadiazine, and silver ions are released slowly into wounded areas. Silver ions catalyse the formation of disulphide bonds leading to structural changes in protein and inactivating thiol-containing enzymes[2]. It inhibits the bacteria by intercalate DNA thereby interfering with replication and transcription[3,4]. Some of the common side effects are burning, itching, and pain of the treated skin. Rarely does it show hypersensitivity reactions. Application to larger wound areas or severe burns may lead to systemic absorption and lead to adverse effects similar to those of other sulphonamides[5]. An overdose of sulfadiazine may cause symptoms such as passing out or trouble breathing. Bioavailability of silver sulfadiazine is very poor [<1% (silver), 10% (sulfadiazine)][6].
Intrinsic physicochemical properties have lots of role in the drug solubility, absorption, bioavailability, etc. Therefore, in this study, special attention was taken to improve these parameters of the silver sulfadiazine. The chemicals which have poor solubility profile are very limited penetration through the intact skin[7]. In this scenario, it was observed that Biofield Energy Healing Treatment (The Trivedi Effect®) has the incredible impact on various properties such as particle size, surface area, and thermal behaviour of pharmaceutical/nutraceutical compounds[8-11]. The Trivedi Effect® is a natural and only scientifically proven phenomenon in which a person can harness this inherently intelligent energy and transmit it anywhere on the planet via the possible mediation of neutrinos[12]. An electromagnetic energy field which exists surrounding the living beings, which can transmit the electromagnetic energy in the form of bio-photons, generated by the continuous movement of the electrically charged particles like ions, cells, etc. inside the body is called “Biofield Energy”. Biofield Energy Healer can harness the energy from the environment or the “Universal Energy Field” and can transmit into any living andnon-living object(s), theprocess is called Biofield Energy Healing Treatment[13,14]. Biofield based Energy Therapies have been reported with significant outcomes against various disease[15]. National Center of Complementary and Integrative Health (NCCIH) has recognized and accepted Biofield Energy Healing as a Complementary and Alternative Medicine (CAM) health care approach along with the other therapies, medicines, and practices such as yoga, Qi Gong, Tai Chi, Reiki, hypnotherapy, etc.[16]. These therapies have been accepted by most of the USA population with several advantages[17]. The Trivedi Effect®-Consciousness Energy Healing Treatment well recognized and reported withscientific data showing astounding capability to alter the characteristic properties of the several non-living materials and living object(s), i.e.organic compounds, metals and ceramic[18-20], microbes[21,22], crops[23,24], etc. The Trivedi Effect® Treatment has also enhanced the bioavailability[25,26] pharmaceutical compounds and isotopic abundance ratio[27,28] of many organic compounds.
The stable isotope ratio analysis has various applications in different scientific fields for understanding the isotope effects resulting from the variation of the isotopic composition of the molecule[29,30]. Isotope ratio analysis can be performed by using the conventional mass spectrometry (MS) techniques such as gas chromatography - mass spectrometry (GC-MS) and liquid chromatography - mass spectrometry (LC-MS) in low micromolar concentration with sufficient precision[30,31]. The Trivedi Effect®-Biofield Energy Healing Treatment could be an economical approach for designing better pharmaceuticals formulations. Therefore, LC-MS and GC-MS were used in this study to characterize the structural properties and evaluate the isotopic abundance ratio analysis of PM+1/PM (2H/1H or 13C/12C or 15N/14N or 17O/16O or 33S/32S) and PM+2/PM (34S/32S) in The Trivedi Effect® - Consciousness Energy Healing Treated silver sulfadiazinecompared to the control sample.
Materials and Methods
Chemicals and Reagents
Silver sulfadiazine was purchased from Tokyo Chemical Industry Co., Ltd., Japan. All other chemicals used during the experiments were of analytical grade available in India.
Consciousness Energy Healing Treatment Strategies
The silver sulfadiazine powdertaken for the experiment was the test sample divided into two parts. One part of silver sulfadiazine powder sample was considered as a control sample, where no Biofield Energy Treatment was provided. However, the other part of silver sulfadiazine was treated with The Trivedi Effect®-Consciousness Energy Healing Treatment remotely under standard laboratory conditions for 3 minutes and known as The Trivedi Effect® Treated or Biofield Energy Treated silver sulfadiazine sample. The Biofield Energy Treatment was provided through the healer’s unique energy transmission process by the renowned Biofield Energy Healer, Alice Branton, USA, to the test sample. Further, the control sample was treated with “sham” healer for comparison purpose. The sham healer did not have any knowledge about the Biofield Energy Treatment. After that, the Biofield Energy Treated and untreated silver sulfadiazine samples were kept in sealed conditions and characterized using LC-MS and GC-MS analytical techniques.
Characterization
Liquid Chromatography-Mass Spectrometry (LC-MS) Analysis and Calculation of Isotopic Abundance Ratio: The LC-MS analysis of the control and Biofield Energy Treated silver sulfadiazine was carried out with the help of LC-MS Thermo Fisher Scientific, the USA equipped with anion trap detector connected with a triple-stage quadrupole mass spectrometer. The column used here was a reversed phase Thermo Scientific Synchronis C18 (Length-250 mm XID 4.6 mm X 5 micron), maintained at 25˚C. The diluent used for the sample preparation was methanol.5 µL of silver sulfadiazine solution was injected, and the analyte was eluted using acetonitrile + 10 mM ammonium acetate (80:20) pumped at a constant flow rate of 0.6 mL/min. Chromatographic separation was achieved using gradient condition and the total run time was 10 min. Peaks were monitored at 254 nm using the PDA detector. The mass spectrometric analysis was performed under +ve ESI mode. The total ion chromatogram, peak area% and mass spectrum of the individual peak which was appeared in LC along with the full scan (m/z 50-500) were recorded. The total ion chromatogram and mass spectrum of the individual peak were recorded.
The natural abundance of each isotope (C, H, N, O, and S) can be predicted from the comparison of the height of the isotope peak with respect to the base peak. The values of the natural isotopic abundance of the common elements are obtained from the literature[30,32-34]. The LC-MS based isotopic abundance ratios (PM+1/PM) for the control and Biofield Energy Treated silver sulfadiazine was calculated.
Percentage (%) change in isotopic abundance ratio = [(IARTreated – IARControl)/ IARControl) x 100]
Where IARTreated = isotopic abundance ratio in the treated sample and IARControl = isotopic abundance ratio in the control sample.
Gas chromatography-mass spectrometry (GC-MS) analysis: GC-MS of the control and Biofield Energy Treated sample of silver sulfadiazine were analyzed with the help of Perkin Elmer Gas chromatograph equipped with a PE-5MS (30M x250 microsx0.250 microns) capillary column and coupled to a single quadrupole mass detector was operated with electron impact (EI) ionization in positive mode. Oven temperature was programmed from 75°C (5 min hold) to 280°C (14.5 min hold) @ 10°C /min (total run time 40 min). The sample was prepared taking 60 mg of the silver sulfadiazine in 4 ml dimethyl sulfoxide (DMSO) as a diluent. Mass spectra were scanned from m/z 20 to 400. The identification and characterization of analyte were done by GC retention times and by a comparison of the mass spectra of samples.
The GC-MS based isotopic abundance ratios (PM+1/PM and PM+2/PM) for the control and Biofield Energy Treated sulfadiazine was calculated.
Percentage (%) change in isotopic abundance ratio = [(IARTreated – IARControl)/ IARControl) x 100]
Where IARTreated = isotopic abundance ratio in the treated sample and IARControl = isotopic abundance ratio in the control sample.
Results and Discussion
Liquid chromatography-mass spectrometry (LC-MS)
The LC-MS chromatograms of silver sulfadiazine showed the single major chromatographic peak at the retention time (Rt) of 4.1 minutes in case of both the samples (Figure 1). The similar chromatographic peak Rt indicated that the polarity of both the samples was same.
ESI-MS of the control sample and Biofield Energy Treated samples showed the protonated molecular mass peak [M+H]+ at m/z 251.08 (calculated for C10H11N4O2S+, 251.06) with 100% base peak intensity in the MS spectrum in +ve ion mode was found to be sulfadiazine (Figure 2). The experimental data were well matched with the already reported literature data[35]. Along with the protonated molecular ion peak at m/z 251.08 [M+H]+ other fragmentation peaks at m/z 214.83, 187.17, 173.04, 156, and 95 for C7H11N4O2S+, C7H11N2O2S+, C6H9N2O2S+, C6H6NO2S+, and C4H6N3+, respectively in both the control and Biofield Energy Treated sample (Figures 2 and 3).
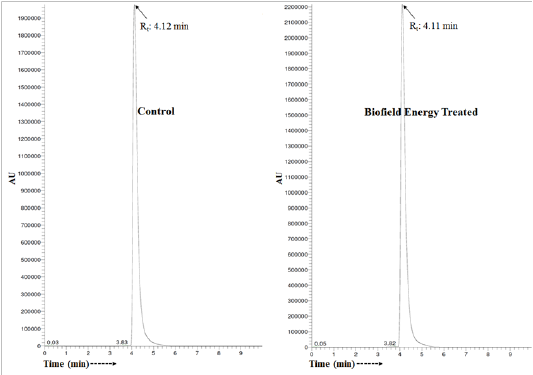
Figure 1: Liquid chromatograms of the control and Biofield Energy Treated silver sulfadiazine.
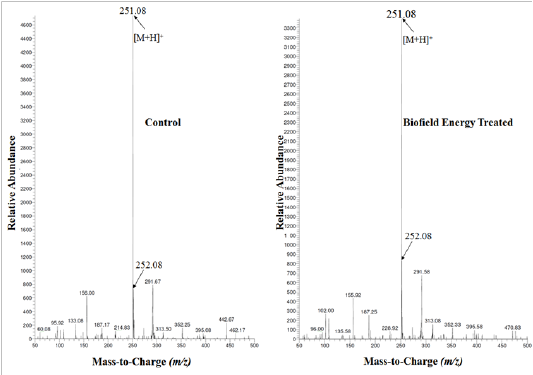
Figure 2: Mass spectra of the control and Biofield Energy Treated sulfadiazineat Rt 4.1 minutes.
The LC-MS spectra of both the control and Biofield Energy Treated silver sulfadiazine showed the mass of the molecular ion peak at m/z 251.08 (calculated for C10H11N4O2S+, 251.06) with 100% relative peak intensity. The theoretical calculation of PM+1 for sulfadiazine was presented as below:
P(13C) = [(10 x 1.1%) x 100% (the actual size of the M- peak)] / 100% = 11%
P(2H) = [(11 x 0.015%) x 100%] / 100%= 0.165%
P(15N) = [(4 x 0.4%) x 100%] / 100% = 1.6%
P(17O) = [(2 x 0.04%) x 100%] / 100% = 0.08%
P(33S) = [(1 x 0.75%) x 100%] / 100% = 0.75%
PM+1, i.e. 13C, 2H, 15N, 17O and 33S contributions from (C10H11N4O2S)+ to m/z 252.08= 13.6%
From the above calculation, it has been found that 13C,15N, and 33S have major contribution to m/z 252.08. The calculated isotopic abundance (13.6%) is close to the experimental value 15.33% (Table 1).
The LC-MS based isotopic abundance ratio analysis PM and PM+1 for sulfadiazine near m/z 251.08 and 252.08, respectively of the control and Biofield Energy Treated samples,which were obtained from the observed relative peak intensities of [M+] and [(M+1)+] peaks, respectively in the ESI-MS spectra (Table 1). The percentage change of the isotopic abundance ratio (PM+1/PM) in the Biofield Energy Treated silver sulfadiazine was significantly increased by 59.03% compared with the control sample (Table 1). Therefore, it was concluded that the13C, 2H, 15N,17O, and 33S contributions from (C10H11N4O2S)+ to m/z 252.08 in the Biofield Energy Treated sample were significantly increased compared to the control sample. Table 1, fig 3
Table 1: LC-MS based isotopic abundance analysis results in Biofield Energy Treated sulfadiazine compared to the control sample.
|
Parameter |
Control sample |
Biofield Energy Treated sample |
|
PM at m/z 251.08 (%) |
100 |
100 |
|
PM+1 at m/z 252.08 (%) |
15.33 |
24.38 |
|
PM+1/PM |
0.15 |
0.24 |
|
% Change of isotopic abundance ratio (PM+1/PM) with respect to the control sample |
59.03 |
|
PM: the relative peak intensity of the parent molecular ion [M+]; PM+1: the relative peak intensity of the isotopic molecular ion [(M+1)+], M: mass of the parent molecule.
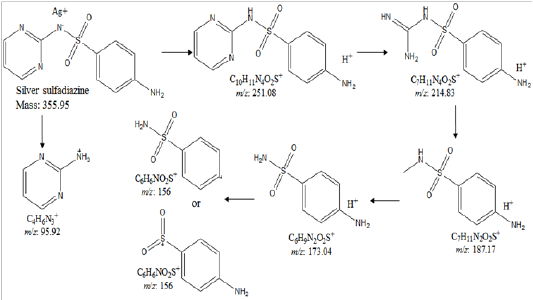
Figure 3: Proposed fragmentation pattern of silver sulfadiazine.
Gas chromatography-mass spectrometry (GC-MS) analysis
The control and Biofield Energy Treated silver sulfadiazine showed the presence of the sharp chromatographic peak at the retention time of 17.71 minutes in the GC-MS chromatograms (Figures 4 and 5). The peak area % of the Biofield Energy Treated sample was very close compared to the control sample. This indicated that the solubility of the Biofield Energy Treated silver sulfadiazine was close compared to the control sample. The GC-MS of silver sulfadiazine did not reflect the parent molecular ion peak in the mass spectra of both the control and Biofield Energy Treated samples. The base peak was observed at m/z 185 (calculated for C7H9N2O2S+, 185.04), along with the lower mass fragment ion peaks (Figures 4 and 5). The isotopic abundance ratio depends upon the mass peak intensities of the particular compounds.
The theoretical calculation of PM+1 and PM+2 for silver sulfadiazine were presented as below:
P(13C) = [(7 x 1.1%) x 100% (the actual size of the M+ peak)] / 100% = 7.7%
P(2H) = [(9 x 0.015%) x 100%] / 100%= 0.135%
P(15N) = [(2 x 0.4%) x 100%] / 100% = 0.8%
P(17O) = [(2 x 0.04%) x 100%] / 100% = 0.08%
P(33S) = [(1 x 0.75%) x 100%] / 100% = 0.75%
PM+1, i.e. 13C, 2H, 15N, 17O, and 33S contributions from (C7H9N2O2S)+ to m/z 185 = 9.47%
Similarly,
P(34S) = [(1 x 4.21%) x 100%] / 100% = 4.21%
PM+2, i.e. 34S contributions from (C7H9N2O2S)+ to m/z 186 = 4.21%
From the above calculation, it has been found that 13C,15N,33S, and 34S have the major contributions to m/z 185 and 186.
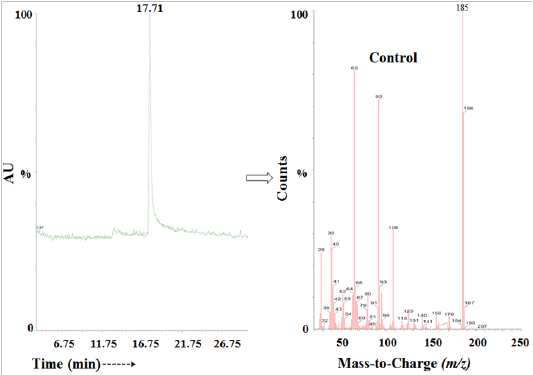
Figure 4: The GC-MS chromatogram and mass spectra of the control sulfadiazine.
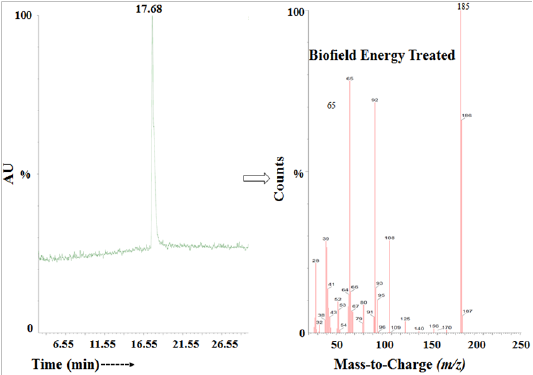
Figure 5: The GC-MS chromatogram and mass spectra of the Biofield Energy Treated sulfadiazine.
Table 2: GC-MS based isotopic abundance analysis results of Biofield Energy Treated sulfadiazine compared to the control samples.
|
Parameter |
Control sample |
Biofield Energy Treated sample |
|
PM at m/z 185 (%) |
100.00 |
100.00 |
|
PM+1 at m/z 186 (%) |
67.90 |
65.86 |
|
PM+1/PM |
0.68 |
0.66 |
|
% Change of isotopic abundance ratio (PM+1/PM) with respect to the control sample |
-3.00 |
|
|
PM+2 at m/z 187 (%) |
6.76 |
5.27 |
|
PM+2/PM |
0.07 |
0.05 |
|
% Change of isotopic abundance ratio (PM+2/PM) with respect to the control sample |
-22.04 |
|
PM: the relative peak intensity of the parent molecular ion [M+]; PM+1: the relative peak intensity of the isotopic molecular ion [(M+1)+]; PM+2: the relative peak intensity of the isotopic molecular ion [(M+2)+]; M: mass of the parent molecule.
The GC-MS based isotopic abundance ratio analysis of the Biofield Energy Treated samples were calculated compared to the control sample. PM, PM+1, and PM+2 for silver sulfadiazine near m/z 185, 186, and 187, respectively of the control and Biofield Energy Treated samples, which were obtained from the observed relative peak intensities of [M+], [(M+1)+], and [(M+2)+] peaks, respectively in the mass spectra (Table 2). The isotopic abundance ratio of PM+1/PM and of PM+2/PM in the Biofield Energy Treated silver sulfadiazine was significantly decreased by 3% and 22.04%, respectively compared with the control sample (Table 2). Hence, 13C, 2H, 15N, 17O,33S, and 34S contributions from(C7H9N2O2S)+ to m/z 186 and 187 in the Biofield Energy Treated sample were significantly decreased compared with the control sample.
The structure of sulfadiazine was confirmed by LC-MS and GC-MS analysis. The isotopic abundance ratios of PM+1/PM (2H/1H or 13C/12C or 15N/14N or 17O/16O or 33S/32S) and PM+2/PM (34S/32S) in the Biofield Energy Treated silver sulfadiazine were significantly altered compared to the control sample. According to science, the neutrinos change identities which are only possible if the neutrinos possess mass and have the ability to interchange their phase from one phase to another internally. Therefore, the neutrinos have the ability to interact with protons and neutrons in the nucleus, which indicated a close relation between neutrino and the isotope formation[12,30,31]. The altered isotopic composition in molecular level of The Trivedi Effect®-Consciousness Energy Healing Treated silver sulfadiazine might have altered the neutron to proton ratio in the nucleus. It can be hypothesized that the changes in isotopic abundance could be due to changes in nuclei possibly through the interference of neutrino particles via The Trivedi Effect®-Consciousness Energy Healing Treatment. The overall results concluded that The Trivedi Effect®-Consciousness Energy Healing Treatment might create a new form of silver sulfadiazinewhich would be more suitable for the prevention and treatment of bacterial infections, superficial and partial thickness burn injuries, etc.
Conclusion
The Trivedi Effect®-Consciousness Energy Healing Treatment showed the significant impact on the isotopic abundance ratios and mass peak intensities of silver sulfadiazine. The LC-MS spectra of both the control and Biofield Energy Treated samples at retention time (Rt) 4.1 minutes exhibited the mass of the protonated molecular ion peak at m/z 251.08 (calculated for C10H11N4O2S+, 251.06) with 100% base peak intensity in the MS spectrum in +ve ion mode was found to be sulfadiazine. The LC-MS based isotopic abundance ratio of PM+1/PM in the Biofield Energy Treated sulfadiazine was significantly increased by 59.03% compared with the control sample. Thus, 13C, 2H, 15N, 17O, and 33S contributions from (C10H11N4O2S)+ to m/z 252.08 in the Biofield Energy Treated sample were significantly increased compared with the control sample. The control and Biofield Energy Treated silver sulfadiazine showed the presence of the chromatographic peak at the retention time of 17.71 min in the GC-MS chromatograms. The GC-MS based isotopic abundance ratio of PM+1/PM and PM+2/PM in the Biofield Energy Treated sulfadiazine was significantly decreased by 3% and 22.04%, respectively compared with the control sample. Hence, 13C, 2H, 15N, 17O, 33S, and 34S contributions from (C7H9N2O2S)+ to m/z 186 and 187 in the Biofield Energy Treated sample were significantly decreased compared with the control sample. The isotopic abundance ratios of PM+1/PM (2H/1H or 13C/12C or 15N/14N or 17O/16O or 33S/32S) and PM+2/PM (34S/32S) in the Biofield Energy Treated silver sulfadiazine were significantly decreased compared to the control sample. It can be assumed that the changes in isotopic abundance and mass peak intensities could be due to changes in nuclei possibly via the interference of neutrino particles controlled by The Trivedi Effect® - Consciousness Energy Healing Treatment. The new form of silver sulfadiazine would be better for designing novel pharmaceutical formulations that might offer better therapeutic response against bacterial infections, superficial and partial thickness burn injuries, etc.
Acknowledgements
The authors are grateful to Sophisticated Instrumentation Centre for Applied Research & Testing (SICART) India, Trivedi Science, Trivedi Global, Inc., Trivedi Testimonials, and Trivedi Master Wellness for their assistance and support during this work.
References
- 1. Marx, J., Walls, R., Hockberger, R. Rosen’s Emergency Medicine-Concepts and Clinical Practice, Volume 2, 8thEdn. (2013) Elsevier Health Sciences, US.
PubMed│CrossRef│Others
- 2. “WHO Model List of Essential Medicines” (2019) World Health Organization 205: 126.
PubMed│CrossRef│Others
- 3. Rosenkranz, H.S., Carr, H.S. Silver Sulfadiazine: Effect on the Growth and Metabolism of Bacteria. (1972) Antimicrob Agents Chemother 2(5): 367-372.
- 4. Wysor, M.S., Zollinhofer, R.E. On the mode of action of silver sulfadiazine. (1972) Pathobiol 38: 296-308.
- 5. “Silver Sulfadiazine”. Drugs.com. Retrieved 15 May 2018.
PubMed│CrossRef│Others
- 6. https://en.wikipedia.org/wiki/Silver_sulfadiazine.
- 7. Charles, H.N., James, E.A., Milo, G. Physiologic surface active agents and drug absorption VIII: Effect of bile flow on sulfadiazine absorption in the rat. (1971) J Pharm Sci 60(1): 145-147.
- 8. Trivedi, M.K., Branton, A., Trivedi, D., et al. Evaluation of Physicochemical, Thermal, Structural, and Behavioral Properties of Magnesium Gluconate Treated with Energy of Consciousness (The Trivedi Effect®). (2017) J Drug Design Med Chem 3: 5-17.
- 9. Trivedi, M.K., Branton, A., Trivedi, D., et al. A comprehensive physical, spectroscopic, and thermal characterization of Withania somnifera (ashwagandha) root extract treated with the energy of consciousness (The Trivedi Effect®). (2017) Int J Biomed Mater Res 5: 5-14.
PubMed│CrossRef│Others
- 10. Trivedi, M.K., Branton, A., Trivedi, D., et al. Evaluation of physicochemical, spectral, thermal and behavioral properties of the biofield energy healing treated sodium selenate. (2017) Sci J Chem 5(2): 12-22.
PubMed│CrossRef│Others
- 11. Trivedi, M.K., Patil, S., Shettigar, H., et al. Spectroscopic characterization of chloramphenicol and tetracycline: An impact of biofield. (2015) Pharm Anal Acta 6: 395.
- 12. Trivedi, M.K., Mohan, T.R.R. Biofield energy signals, energy transmission and neutrinos. (2016) Am J Modern Phys 5(6): 172-176.
- 13. Rubik, B. The biofield hypothesis: Its biophysical basis and role in medicine. (2002) J Altern Complement Med 8: 703-717.
- 14. Nemeth, L. Energy and biofield therapies in practice. (2008) Beginnings 28: 4-5.
- 15. Rubik, B., Muehsam, D., Hammerschlag, R., et al. Biofield science and healing: history, terminology, and concepts. (2015) Glob Adv Health Med 4(Suppl): 8-14.
- 16. Koithan, M. Introducing complementary and alternative therapies. (2009) J Nurse Pract 5: 18-20.
- 17. Barnes, P.M., Bloom, B., Nahin, R.L. Complementary and alternative medicine use among adults and children: United States, 2007. (2008) Natl Health Stat Report 12: 1-23.
- 18. Trivedi, M.K., Branton, A., Trivedi, D., et al. Isotopic abundance ratio analysis of 1,2,3-trimethoxybenzene (TMB) after biofield energy treatment (The Trivedi Effect®using gas chromatography-mass spectrometry. (2016) Am J Appl Chem 4(4): 132-140.
- 19. Trivedi, M.K., Tallapragada, R.M., Branton, A., et al. Physicochemical and atomic characterization of silver powder after biofield treatment. (2015) J Bioengineer Biomedical Sci 5: 165.
- 20. Trivedi, M.K., Nayak, G., Patil, S., et al. Studies of the atomic and crystalline characteristics of ceramic oxide nano powders after bio field treatment. (2015) Ind Eng Manage 4: 161.
- 21. Trivedi, M.K., Branton, A., Trivedi, D., et al. Antibiogram, biochemical reactions and genotyping characterization of biofield treated Staphylococcus aureus. (2015) Am J Bio Sci 3: 212-220.
PubMed│CrossRef│Others
- 22. Trivedi, M.K., Branton, A., Trivedi, D., et al. Antimicrobial sensitivity, biochemical characteristics and biotyping of Staphylococcus saprophyticus: An impact of biofield energy treatment. (2015) J Women’s Health Care 4: 271.
PubMed│CrossRef│Others
- 23. Trivedi, M.K., Branton, A., Trivedi, D., et al. Agronomic characteristics, growth analysis, and yield response of biofield treated mustard, cowpea, horse gram, and groundnuts. (2015) Intl J Genet Genom 3: 74-80.
- 24. Trivedi, M.K., Branton, A., Trivedi, D., et al. Evaluation of plant growth, yield and yield attributes of biofield energy treated Mustard (Brassica juncea) and Chick pea (Cicer Arietinum) Seeds. (2015) Agricult Forest Fisheries 4: 291-295.
- 25. Branton, A., Jana, S. The use of novel and unique biofield energy healing treatment for the improvement of poorly bioavailable compound, berberine in male Sprague Dawley rats. (2017) Am J Clin Exper Med 5(4): 138-144.
- 26. Branton, A., Jana, S. The influence of energy of consciousness healing treatment on low bioavailable resveratrol in male Sprague Dawley rats. (2017) Intl J Clin Develop Anatomy 3(3): 9-15.
PubMed│CrossRef│Others
- 27. Trivedi, M.K., Branton, A., Trivedi, D., et al. Determination of isotopic abundance ratio of biofield energy treated 1,4-dichlorobenzene using gas chromatography-mass spectrometry (GC-MS). (2016) Modern Chem 4: 30-37.
- 28. Trivedi, M.K., Branton, A., Trivedi, D., et al. Gas chromatography-mass spectrometric analysis of isotopic abundance of 13C, 2H, and 18O in biofield energy treated p-tertiary butylphenol (PTBP). (2016) Am J Chem Engg 4: 78-86.
PubMed│CrossRef│Others
- 29. Schellekens, R.C., Stellaard, F., Woerdenbag, H.J., et al. Applications of stable isotopes in clinical pharmacology. (2011) Br J Clin Pharmacol 72: 879-897.
- 30. Weisel, C.P., Park, S., Pyo, H., et al. Use of stable isotopically labeled benzene to evaluate environmental exposures. (2003) J Expo Anal Environ Epidemiol 13(5): 393-402.
- 31. Muccio, Z., Jackson, G.P. Isotope ratio mass spectrometry. (2009) Analyst 134(2): 213-222.
- 32. Rosman, K.J.R., Taylor, P.D.P. Isotopic compositions of the elements 1997 (Technical Report). (1998) Pure Appl Chem 70: 217-235.
- 33. Smith, R.M. Understanding Mass Spectra: A Basic Approach, Second Edition. (2004) John Wiley & Sons, Inc.
PubMed│CrossRef│Others
- 34. Jürgen, H. Gross Mass Spectrometry: A Textbook (2ndEdn). (2004) Springer: Berlin.
PubMed│CrossRef│Others
- 35. Pfeifer, T., Tuerk, J., Bester, K., et al. Determination of selected sulfonamide antibiotics and trimethoprim in manure by electrospray and atmospheric pressure chemical ionization tandem mass spectrometry. (2002) Rapid Commun Mass Spectrom 16(7): 663-669.


