Changing Electrocardiogram Waveforms to Quantitatively Assess Myocardial function: New Hypothesis and Validation Experiment regarding the U Wave
Kenneth Tsan He1*, Helena Ai He2
Affiliation
1Princeton International School of Mathematics and Science, 11th grade student, 19 Lambert Drive, Princeton
2Princeton International School of Mathematics and Science, 10th grade student, 19 Lambert Drive, Princeton
Corresponding Author
Princeton International School of Mathematics and Science, 11th grade student, 19 Lambert Drive, Princeton, NJ, Tel: 08540; 1-732-705-0282; Email: Kenny.he@prismsus.org
Citation
Kenneth, T. H.,et al.Changing Electrocardiogram Waveforms to Quantitatively Assess Myocardial function: New Hypothesis and Validation Experiment regarding the U Wave (2020) J Heart Cardiol 5(1): 15-24.
Copy rights
© 2020 Kenneth, T. H. This is an Open access article distributed under the terms of Creative Commons Attribution 4.0 International License.
Keywords
Electrocardiogram; U wave; T wave; Apex beat; Heart muscle function
Abstract
A hypothesis regarding the U wave is proposed, where the collision of the heart apex and chest wall causes delayed repolarization of some myocardial cells due to compression and deformation, leading to the presence of the U wave on ECG. Under normal conditions, the stronger the myocardial contractility, the greater the mass of the heart, the closer the distance to the chest wall, the more intense the apex beat, the more cells deformed and repolarization delayed, and the longer the delay time. To test the hypothesis, 41 high school student volunteers participated in a clinical trial. The results showed that when the position was changed from the supine position to the left lateral position, the U wave increased significantly (0.24±0.095×0.1 mv, a=99%), the T wave significantly decreased (-1.3±0.74×0.1 mv, a=99%), the time difference between the two peaks significantly increased (0.38±0.12×40 ms, a= 99%), indicating a strong co-rrelation between those three values ( r= 0.87 and 0.39). Similar results were obtained when reducing the distance between the chest wall and heart using an inflatable pressure airbag, further confirming the hypothesis. Thus explaining the various mysterious phenomena about the U wave that have puzzled many for years. This experiment also showed a strong correlation between the ratio of the U and T wave amplitudes and the 1000 m running times (r= -0.79). Therefore, under certain conditions, the myocardial function of subjects can be quantitatively evaluated and assessed based on the changes of U and T waves by simply changing physical position or compressing the chest region.
Background: A hypothesis regarding the U wave is proposed, where the collision of the heart apex and chest wall (i.e. apex beat) causes delayed repolarization of myocardial cells due to compression/ deformation, leading to the presence of U waves on electrocardiograms. Under normal conditions, the stronger the myocardial contractility, the greater the heart mass, the closer the distance to the chest wall, the more intense the apex beat, the more cells deformed and repolarization delayed due to the reaction force of the chest wall, and the longer the delay. It is shown that the amplitudes of the U and T wave increase and decrease, respectively, and that the time difference between the two peaks increases.
Methods: For validation, 41 students participated in a clinical trial involving changing physical body positions and compressing the chest region for shortening the distance between the volunteers’ chest walls and hearts to observe changes.
Results: Results showed that when body position changed from supine to left lateral, the U wave amplitude increased significantly due to shortening of the distance between the chest wall and heart (0.24±0.095×0.1 mv, α= 99%), the T wave amplitude significantly decreased (-1.3±0.74×0.1 mv, α= 99%), and the time difference between the two peaks significantly increased (0.38±0.12×40 ms, α= 99%), indicating a strong correlation between those three values (correlation coefficient r= 0.87 and 0.39). Similar results were obtained when reducing said distance using an airbag, further confirming this hypothesis that the U wave originates from the apical beat, explaining various unsolved phenomena that have persisted for years. This experiment also showed a strong correlation between the ratio of the U and T wave amplitudes and the 800 m and 1000 m running times for the female and male subjects, respectively (r= -0.79).
Conclusion: The myocardial function of individuals can be quantitatively evaluated and assessed based on changes in the U and T waves.
Clinical Trial Registration: http://neirb.com/; IRB No. 120190140
Introduction
The clinical diagnostic value of the U wave present on the electrocardiogram is getting more and more attention and value[1]. U wave abnormalities not only indicate a variety of heart diseases and high blood pressure, but they also are possibly correlated with the use of medication[2] and even the size of tumors caused by cancer[3]. Major heart organizations, including the American Heart Association and the Heart Rhythm Society, recommend that all U wave abnormalities are reported when interpreting the electrocardiogram[2,4].
Although the U wave was discovered more than a hundred years ago, its source still remains unclear[5]. This is regrettable, given the rapid development of electrophysiology and body surface potential mapping. Currently, there are a variety of hypotheses regarding the origin of the U wave. One of the earliest theories proposed regarded the delayed repolarization of Purkinje fibers, but Amphibia have the U wave but no ‘Purkinje fibers[6], the relatively negligible mass of the fibers, combined the abnormal morphology of the U wave, do not conform to known repolarization patterns[4]. Another theory proposes that delayed repolarization of the papillary muscles causes U-wave[4]. A third theory states that the U wave represents the extended repolarization of mid-myocardial M cells. However, the current assumption is that M cells are more likely associated with the QT interval, as M-cell-related waves are referred to as T2 waves. Another theory states that the U wave is a continuation of the total ventricular repolarization, and that the T and U waves form a continuum. But the currently most popular theory is that the U wave results from electrical after-potentials related to mechanical forces in the ventricular walls[4-9]. This theory states that differences in the amount of stretching in cardiac fibers (during relaxation) between the endocardium and epicardium trigger electrical after-potentials, resulting in the presence of the U wave on the electrocardiogram. However, studies have concluded that delayed repolarization caused by the aforementioned deformation differences between regions of the heart are not enough to explain the presence of the U-wave and other related phenomena[10]. These “mystery” phenomena include[4] the U wave amplitude being inversely proportional to heartrate, the U wave amplitude being greater in patients with left ventricular hypertrophy (the thickening of the walls of the left ventricle), the U wave increasing after taking drugs like digital in, the U wave temporarily increasing when experiencing severe anemia, hypothermia, forced inhalation, exercise, and even raising the thigh while lying on the back, and the U wave amplitude being greater in relatively young individuals, men, athletes, relatively skinny people, and those with lower heartrates. Furthermore, a “normal” U wave shows a steep rise and slower descent in terms of the shape of the wave, and this shape is the opposite of the shape of a normal T wave[4].
The author of reference[11] made an interesting experiment. He moved the V4 electrode of ECG up and down in time with a patient rhythm. When the electrode moved away from his heart in diastole the U wave disappeared. When it moved toward it, the U wave became twice the size. The author expected evidence indicates that the U wave is simply a result of ventricular movement[11]. But Everyone’s ventricle is constantly moving. Why do some people have obvious U waves in the ECG, and some people do not have U waves at all?
Studies have shown that changes in physical body position and pressure around the chest may cause changes in ECG waveforms[12-22]. Adams et.al found that lying on the side often causes noticeable changes on the electrocardiogram[12]. Shinar et.al found significantly different durations of the R wave when lying on the prone, supine, and lateral positions[13,14]. Batch varov et.al found that the RR interval on the ECG, while standing, was significantly shorter than that of the supine position[15]. Smit et.al studied the change in the QRS wave of the ECG after normal exhalation, maximum inhalation and maximum exhalation. The overall conclusion is that those respiratory conditions have little effect on the QRS wave group, but the gap is greater than or equal to 1 millimeter in the S and R wave of the V4 and V5 lead, respectively[16]. Hongze Pan et.al found that lying postures had less effect on ECG time-bound-related characteristics. The QT and RR interval when in the left lateral position were lower than those in the supine position. The P and T wave height, area under the QRS and T waves, as well as the QR potential difference were significantly lower than those (corresponding) in the supine position, while those of the S and R waves weresignificantly higher than those in the supine position. The T wave height and area were significantly higher in the supine position compared to those in the right lateral position[17]. None of the afore mentioned studies involved the U wave, nor did they give a reason for the changes in their respective ECG waveforms.
Clinically, doctors usually assess the heart size, function, and Left Ventricular Hypertrophy (LVH) by palpating the apical beat (AB). This method is a highly subjective, non-quantitative method, and the clinical significance is uncertain[18]. Studies have shown that the distance from the heart to the inner wall of the chest cavity is negatively correlated with the estimate of heart size or the magnitude of the apical beat. Patients with unobvious apical beats generally have smaller left ventricles or greater distances from the inner wall of the chest[19]. Other studies have shown that the distance from the heart to the surface of the chest affects the amplitude of the recorded precardiac voltage[20]. However, none of these studies have indicated the causes of said effects.
It is well known that the use of the ECG doesn’t reliably assess the ability of the heart to pump blood, which is usually done by echocardiograms or nuclear medicine[23-25]. However, only when the disease develops to a certain stage (or even later) will these instruments show observed changes, so such early cardiac function diagnosis isn’t effective. The six-minute walking test method (6MWT) was developed by the American Thoracic Society and officially launched in 2002 for heart function evaluation in the middle-aged and elderly population[26]. The method is simple, repeatable and safe, easy to accept by patients, and is widely used in the evaluation of motor tolerance, heart function, lung function and chronic heart failure efficacy and prognosis[27]. The six-minute walking distance of subjects can be correlated with the magnitude of their heart failure (<150”m” for severe heart failure, between 150”m” and 450”m” for moderate heart failure, and >450”m” for mild heart failure). However, 6MWT doesn’t have a high degree of differentiation between patients with mild heart failure, and patients with severe symptoms aren’t able to bear the risks of testing. Therefore, finding a method for evaluating heart function that is simple, convenient, fast and has no operational risk must have important clinical significance.
Hypothesis
Based on the following facts, we believe that the apex beat leads to the presence of the U wave:
From the time perspective, the U wave appears at the end of the heart contraction or before the diastolic period, just during the time range of the heart’s impact on the inner wall of the chestaccompanied by the second (S2) heart tone appearance[4]. From a spatial point of view, the U wave is most significant in the V3 lead, followed by the V2 and V4 leads, in the front of the heart area of the lead, the U vector points to the left and the front, just the heart hit the inner wall of the chest; The distance from the heart to the surface of the chest affects the magnitude of the current voltage[19], the distance from the heart to the inner wall of the thoracic cavity was negatively correlated with the amplitude of the thoracic throbbing[19]; when lying on the left side, the Apex beat range is more intense than when you are lying on the left side, and the heart is closer to the inner wall of the chest when you lie on the left side; computer models of the left ventricle complex show that U wave polarity and other U wave characteristics can be explained if there is a delayed potential on the heart action potential[10]; changes in position and chest cavity cause changes in ECG waveforms[12-22]; the T wave amplitude of supine position is higher than left or right side position[17].
The key points of this new U wave hypothesis are as follows:
• Because of the apex beat, part of the left ventricular heart muscle cells (including cardiomyocytes, fibroblasts, endothelial cells, and peri-vascular cells) will with stand the reverse impact coming from the chest wall, which is associated with factors such as myocardial contraction, heart mass, distance between the heart tip and the inner wall of the chest, and the condition of the heart structure and lesions, independent of the thickness and shape of the outer body fat layer of the chest.
• When the impact deformation and deformation rate of these myocardial cells exceed a certain value, their repolarization process will be delayed. The greater the deformation and deformation rate are, the longer the repolarization takes.
• Because of the apex beat, the left ventricle cells are divided into two parts: the cells minimally or not affected by the apex beat and the cells relatively largely affected by the apex beat. The former with a normal repolarization process forms the T wave, while the latter with a delayed repolarization process forms the U wave.
• The quantities left ventricle cells in the two repolarization stages were positively correlated with the area under the T and U wave and roughly positively correlated with the amplitudes of said waves. The time difference between the two repolarization stages is roughly represented by the time difference between the two wave peaks.
• In the case of healthy subjects, the more intense the apex beat, the greater number of the affected left ventricle cells, and the less the number of less affected cells, and thus the higher the U wave, the lower the T wave, and the greater the time difference between the two peaks. Because the current flows are the same, the two waves have the same forward polarity.
• In myocardial cell ischemia and other non-normal conditions, if the ischemic part of the cell to bear the effects of Apex beat, ischemia will be more serious, its compound delay will be more serious; not only can it not repolarize, it can even allow some of the compound cells to polarize again, resulting in U wave disappearance or inverted abnormal situation.
• In the case of the presence of pathological factors (myocarditis, palate itist, myocardial infarction, thoracic fluid, gas, thoracic adhesion, etc.) and non-pathological factors (movement, lift or downward movement of the diaphragm cause dicardial shift, etc.), the change in U wave amplitude is associated with heart mass (or size) M, distance S between heart and chest wall, and heart contraction P.
a. If S and P remain the same, the larger M would be, the greater the change of momentum when the heart hits the chest wall, the greater the deformation and pressure deformation rate of the heart cells, and the higher the U wave amplitude.
b. If M and S remain the same, the greater P would be, the greater the acceleration of the heart contraction and the greater the contact speed with the chest wall, the greater the change in momentum when the chest wall is impacted, the greater the deformation and deformation rate of the heart cell, and the higher the U wave amplitude.
c. If M and P remain unchanged, the smaller S would be, when the apex beat occurs, the longer the contact time between the heart and the chest wall, the more myocardial cells that are squeezed by the chest wall, the greater the deformation and deformation rate, the higher the U wave amplitude.
But the above hypothesis may not be the only valid one since the presence of U wave is undeniable when there is an accessory papillary muscle.
Purpose
To verify the proposed U wave hypothesis and to find a simple way to assess heart function, the distance between the heart and chest wall of subjects was purposefully reduced and corresponding changes of U and T wave were measured.
Methods
Note that prior to experimentation, approval from the New England Institutional Review Board was obtained. This was necessary as this research involves human subjects.
41 volunteers (35 male and 6 female) were involved in a clinical trial. Those volunteers consisted of high school students, aged 15 to 18. First, the height and weight of the volunteers were measured, and then a stopwatch was used to measure the time it took for each of the volunteers to run 1000 meters (for male) or 800 meters (for female).
Afterward, when the volunteers were given adequate time to rest, a standard 12-lead ECG device (COMEN CM100) was used to measure the volunteer’s electrocardiograms in the left lateral, right lateral, and supine positions. The volunteers were then asked to sit upright, attach electrodes, and wrap an airbag around their entire chests. This air bag doesn’t affect the shape of the chest when not inflated. After pressure due to inflation was applied, the chest cavity was squeezed and thus was smaller. ECGs were, measured both without inflation (0kPa) and with inflation (50kPa). Interference in the ECG waveforms was present; they came from baseline drift caused by muscle electrical activity at a frequency between 2Hz and 2kHz, and respiratory coupling in volunteers. To eliminate interference, volunteers were allowed to obtain sufficient rest before said ECGs were taken, and they were also told to relax during those measurements and to hold their breath for a short period of time when the instrument was collecting data. In addition, the floating filter and the AC filter were used to eliminate other interference. Since the U wave amplitude is very small, the electrocardiogram was magnified several times before measuring. The parameters of the ECG device were set as follows: scan speed 25 mm⁄s , sensitivity 20 mm ⁄mv, ECG sampling frequency of 200Hz .
The parameters required for measurements and calculationsincluded the following:
• The U wave amplitude of each volunteer’s V3 lead (in tenths of millivolts): Ul,Ur, Us,U0, and U50 represent the left lateral position, right lateral position, supine position, upright position with no inflation pressure, and upright position with the 50kPa added pressure, respectively. When measuring the U wave amplitudes, the lowest points between the U and T waves were set as the base point (see Figure 1).
• The T wave amplitude of each volunteer’s V3 lead (in tenths of millivolts):Tl, Tr, Ts, T0, and T50 represent the left lateral position, right lateral position, supine position, upright position with no inflation pressure, and upright position with the 50kPa added pressure, respectively. When measuring the T wave amplitudes, the lowest points between the U and T waves were set as the base point (see Figure 1).
• The time differences between the T and U wave peaks of each volunteer’sV3 lead (units of 40 ms ): Jl, Jr, Js, J0, and J50 represent the left lateral position, right lateral position, supine position, upright position with no inflation pressure, and upright position with the 50kPa added pressure, respectively (see Figure 1).
• Body mass index (BMI): calculated based on every volunteer’s height and weight.
• t1k (in seconds): the time forevery male volunteer to run1000 m .
• t0.8k (in seconds): the time for every female volunteer running 800 m .
Considering the inversely proportional relationship between heart rate and U wave amplitude[4], the U and T wave amplitudes in different body positions and airbag pressures were corrected according to the heart rates taken during measurement.
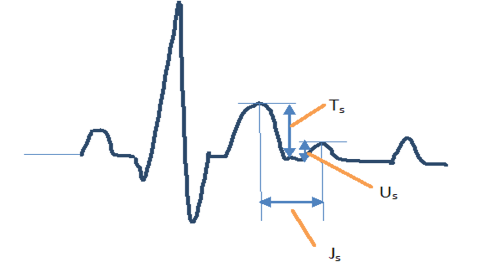
Figure 1: A diagram depicting how the measurement of the amplitudes of the U and T waves and the time difference between the two peaks was carried out.
Results
The experiments, along with the analyzed data, showed that there is a clear correlation between the U wave amplitude, T wave amplitude, the time difference between the two peaks, and the volunteer’s body positions. Changing position caused significant changes in these parameters. The inflatable pressure of the air bag also caused the parameters to change.
Figure 2 is the ECG (V3) of volunteer A (in supine position)Figure 3 is the ECG (V3) of volunteer A (in right lying position). Figure 4 is the ECG (V3) of volunteer A (in left lying position). Figure 5 is the ECG (V2) of volunteer B (airbag pressure 0 kPa). Figure 6 is the ECG (V2) of volunteer B (airbag pressure 50 kPa).
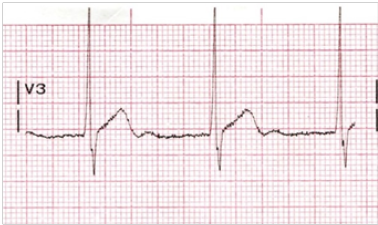
Figure 2: Volunteer A ECG V3 (in supine position)
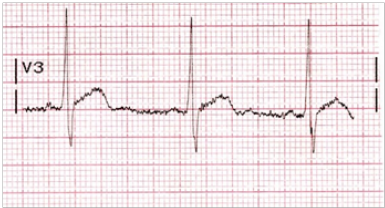
Figure 3: Volunteer A ECG V3 (right lying position)
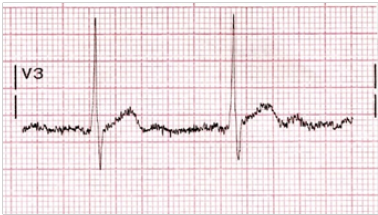
Figure 4: Volunteer A ECG V3 (left lying position)
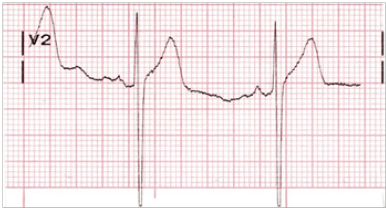
Figure 5: Volunteer B ECG V2 (airbag pressure 0 kPa)
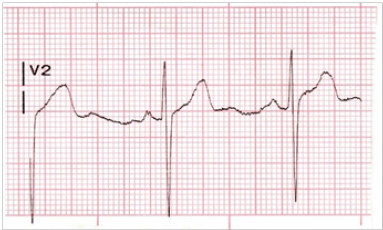
Figure 6: Volunteer B ECG V2 (airbag pressure 50 kPa)
Table 1A: The average U and T wave amplitude differences and time difference between two wave peaks under different body positions and airbag pressures.
|
Parameter (Avg.) |
(Ul-Us ) |
(Tl-Ts ) |
(Jl-Js ) |
(Ur-Us ) |
(Tr-Ts ) |
(Jr-Js ) |
|
Amplitude Difference (0.1 mv) |
0.244±0.095 |
-1.303±0.740 |
|
0.171±0.170 |
1.016±0.780 |
|
|
Time Difference (40 ms ) |
|
|
0.377±0.120 |
|
|
0.300±0.200 |
|
Volunteer No. |
41 |
41 |
41 |
32 |
32 |
32 |
Table 1B: The average U and T wave amplitude differences and time difference between two wave peaks under different body positions and airbag pressures.
|
Parameter (Avg.) |
(U0-Us ) |
(T0-Ts ) |
(J0-Js ) |
(U50-U0 ) |
(T50-T0 ) |
(J50-J0 ) |
|
Amplitude Difference (0.1 mv) |
0.208±0.017 |
-0.134±0.960 |
|
0.113±0.069 |
-0.720±0.600 |
|
|
Time Difference (40 ms ) |
|
|
0.070±0.250 |
|
|
0.268±0.260 |
|
Volunteer No. |
39 |
39 |
39 |
39 |
39 |
39 |
Tables 1A and 1B show the average range of variations for these parameters. In these tables,“(Ul-Us )” represents the average increase of 41 volunteers when their body position changed from supine to left lateral (this notation similarly applies for the other parameters). The confidence level of the average confidence interval in the table is 99%. Nine volunteers had disturbances in the data in the right lateral position and weren’t accounted for in the statistics. Two volunteers did not participate in chest compression tests for personal reasons.
In order to find out the relationship between the various parameter combinations in different positions and airbag pressure, correlation coefficients were calculated, and they are present in Table 2.
Figures 7 and 8 are the scatter plots of the relationships between sets of parameters.
In order to find the relationship between different parameter combinations andthe 1000 m and 800 m long-run times (as appropriate), the following correlation coefficients were calculated and are shown in Table 3.
Figures 9 and 10 are the scatterplots of the relationships between sets of parameters.
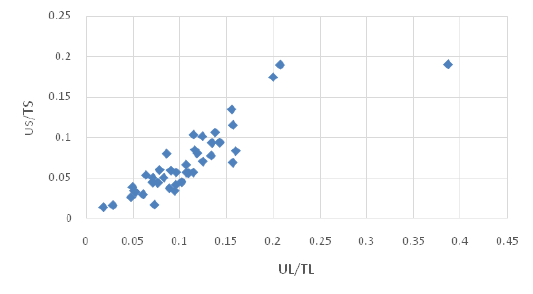
Figure 7: The relationship between Us⁄Ts and Ul⁄Tl
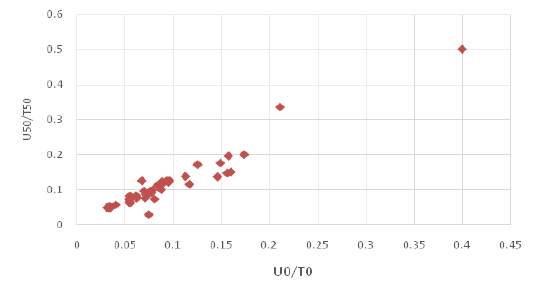
Figure 8: The relationship between U0⁄T0 and U50⁄T50.
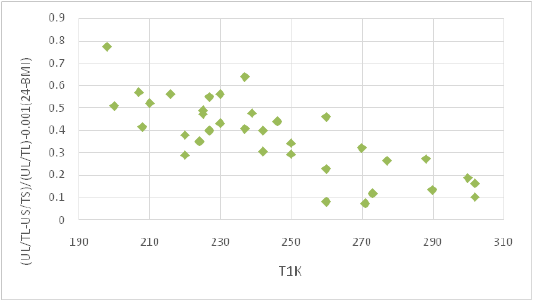
Figure 9: The relationship between (Ul⁄Tl -Us⁄Us )/(Ul⁄Tl )-0.001(24-”BMI” )and t1k.
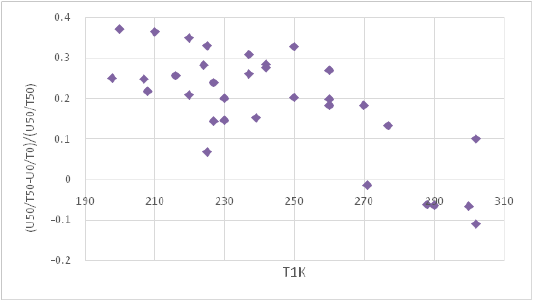
Figure 10: The relationship between (U50⁄T50 -U0⁄T0 )/(U50⁄T50 )and t1k.
Discussion
Table 1A shows that the average U wave amplitude in the V3 lead increased significantly when body position changed from the supine to left lateral position: ((Ul-Us)) ̅=0.244±0.095×0.1 mv (α= 99%). This result cannot be explained by any preexisting U wave theory. It is difficult to imagine that changes in position will cause changes to the state and number of Purkinje fibers, nipple muscles or M cells. It is also difficult to imagine that the left lateral position will cause the entire endocardial and outer membrane fibers diastolic differences, and that when in the supine position, the differences will disappear. A plausible explanation is that because the left lung is smaller than the right lung, the heart is located toward the left side of the chest, and the tip of the heart has a large twist ingesting range when lying on the left side[17], and due to gravity, the tip of the heart near the lower left side of the heart[20], so that the heart can not only be more free to twist in reverse to hit the chest wall, the impact force is greater, but also the chest wall is closer, resulting in more cells with greater deformation and deformation rate. According to our hypothesis, the U wave amplitude would be significantly larger than that in the supine position. This result is consistent with the clinical phenomenon that the apex beat would be stronger in the left lateral position[17]. Of the 41 volunteers, only two had lower U wave amplitudes in the left lateral position than that in the supine position: (Ul-Us)= -0.209×0.1 mv and-0.100×0.1 mv). The 1000 m long-run times of the two volunteers were also longer (t1k=302 s and 277 s). This is linked to their poor systolic function. We speculate that in cases where the chest wall is very close to the tip of the heart, said twisting is quickly blocked by the chest wall, and if contraction of the heart muscle cells is weak, this obstruction can affect the late contraction of the left ventricle and even cause the contraction period to end earlier; this is characterized by a decrease in U wave amplitude.
Furthermore, Table 1A shows that the average T wave amplitude in the V3 lead is significantly smaller in the left lateral position compared to the supine position: (Tl-Ts ) = -1.303 ± 0.740×0.1 mv (α=99%). Studies have suggested that because the position of the bottom of heart is fixed, the apex swings to the left, and the VCG in the frontal plane rotates anticlockwise. So that the projection lengths of P loop and T loop in lead II direction are reduced, that means, the heights of P wave and T wave in ECG wave form decrease. Reflected in the wave form features, P peaks as well as T peak were significantly reduced[17]. However, this statement doesn’t explain why U waves increase simultaneously. According to our hypothesis, at least part of the decrease of the T wave amplitude is correlated with the increase in U wave amplitude. To eliminate the effects of electrical parameters (sensitivity, contact resistance between electrodes and skin), body structure (changes in heart position, changes in body fluid distribution causing changes in chest impedance), and other factors (such as respiratory coupling), using the ratios of U wave and T wave amplitude (Us / Ts and Ul / Tl) to compare their correlation. A very high correlation coefficient (r=0.871) can be seen in Table 2 and Figure 7. This indicates that the increase and decrease in U and T wave amplitude, respectively, are strongly correlated events that occur simultaneously.
Studies have shown that most ECG time characteristics don’t differ significantly between different positions, that only QT and RR periods in the left lateral position are lower than thatin the supine position[17]. However, Table 1A shows a significant increase in time difference when changing position from supine to left lateral: ((Jl-Js ) ̅) = 0.377 ± 0.120×40 ms (α= 99%). This finding further supports our U wave hypothesis.
While in the right lateral position, the heart vertex moves toward the vertical barrier and rotates clockwise along the long axis. The tendency to tilt to the right is shown on the electric shaft. However, the mediastinum can support the heart, the apical range of motion is limited, making the apex less pulsating than the left side. From Table 1A, the average U wave amplitude has a slight increase when changing position from supine to right lateral: ((Ur-Us ) ̅) = 0.171 ± 0.170×0.1 mv (α= 99%). Of the 32 volunteers, eighthad a negative (Ur-Us) value. This is consistent with the conclusion of previous literature17, that the waveform features rarely show the difference between the supine and right lateral position. However, the correlation between the U and T wave still exists; the correlation coefficient rbetween (Us⁄Ts ) and (Ur⁄Tr ) is 0.631, as shown in Table 2.
Table 2: The correlation coefficients between various parameter combinations at different positions and airbag pressures.
|
Parameter 1 |
Parameter 2 |
Correlation Coefficient r |
|
Us |
Body Mass Index |
0.008 |
|
Ul-Us |
Body Mass Index |
0.068 |
|
Ul-Us |
Tl-Ts |
0.124 |
|
Ul⁄Tl |
Us⁄Ts |
0.871 |
|
Ul⁄Tl -Us⁄Ts |
Jl-Js |
0.358 |
|
Ul⁄Ts |
Tl⁄Ts |
-0.173 |
|
Us⁄Ts |
Ur⁄Tr |
0.631 |
|
Ul⁄Tl |
Ur⁄Tr |
0.638 |
|
Ur⁄Tr -Us⁄Ts |
Jr-Js |
0.174 |
|
Us⁄Ts |
U0⁄T0 |
0.591 |
|
Ts-T0 |
Js-J0 |
0.188 |
|
U50⁄T50 |
U0⁄T0 |
0.959 |
|
Ts-T0 |
Js-J0 |
0.170 |
It is clear from Table 2 that the U and T wave ratios under different positions are strongly correlated with each other. For example, r=0.871 when comparing the left lateral and supine positions, r=0.638 when comparing the left lateral and right lateral positions, r=0.631 when comparing the right lateral and supine positions, and r=0.591 when comparing the sitting and supine positions. This shows that the U and T wave amplitude ratio(U⁄T) is a special parameter related to an individual’s heart condition. If a person’s ((U)⁄T) measured in the supine position is lower than that of a normal individual, the magnitudes of these ratios measured in other positions are also lower than those of said normal individual.
From Table 1B, the U wave amplitude significantly increases whenbody position was changed from supine to sitting upright:(U0-Us) = 0.208 ± 0.017 (α=99%), (Us⁄Ts) and (U0⁄T0 ) arealso correlated (r=0.590) as shown in Table 2. This indicates that the apex beat is stronger when sitting upright than that in the supine position, which may be based on the fact that the heart is farther away from the chest wall due to gravity when lying on the back. However, the position change between the internal tissues of the chest cavity within the two positions will affect the amplitude of the T wave, which varies from individual to individual, but as said difference between individuals is large, statistical results in Table 1B show that there is no significant change in T wave amplitude between the two positions: ((T0-Ts ) ̅) = -0.134 ± 0.960×0.1 mv (α=99%), which is consistent with the results in the literature previously referred to[17]. For the same reason, there was no significant difference in the time difference between U and T wave peaks: ((Js-J0 ) ̅) = 0.070 ± 0.250×40 ms (α=99%). Nevertheless, the U wave amplitude difference between the sitting and supine positions do exist and is worth noting when measuring electrocardiograms.
Comparing the U and T wave amplitudes under the conditions of 50 kPa and 0 kPa of pressure and the time difference between the two peaks (see Table 1B), we can obtain results similar to those regarding the left lateral and supine positions. It shows that the use of inflatable airbags can reduce the distance between the heart and the chest wall and cause increases in U wave amplitude: (U50-U0 ) =0.113±0.069×0.1 mv (α=99%), decreases in T wave amplitude: (T50-T0 ) = -0.720 ± 0.600×0.1 mv (α=99%), and an extended time interval between the peaks: (J50-J0 ) = 0.268 ± 0.260×40 ms (α=99%). Furthermore, from Table 2, there is a strong correlation between (U50⁄T50 ) and (U0⁄T0 ) (r=0.960). This result cannot be explained by traditional views in relevant literature[17], i.e. that the heart swings to the left and the VCG in the plane rotates counter clockwise, that the projection length of the P-ring and T-ring along the direction of the II lead is reduced, resulting in a decrease in amplitudes of the P and T wave. Because pressure (from airbags) can only force the chest cavity to contract properly, it is not possible to let the chest wall contact and force the heart to turn left. Thus the reasonable explanation is still thats aid pressure forces the chest wall close to the heart; when the apex beat occurs, the longer the contact time between the heart and the chest wall, the more myocardial cells compressed by the chest wall, the greater the deformation and deformation rate, the higher the U wave amplitude.
Traditional views state that skinnier people have higher U wave amplitudes 4, but our research (see Table 2) shows that the BMI index isn’t related with Us (r=0.008) or (Ul-Us) (r=0.068). We believe that the U wave amplitude may be higher in some skinnier individuals compared to fatter individuals, but it isn’t universal. The increase and decrease of the U wave amplitude caused by changes in body position has little to do with BMI.
|
Parameter 1 |
Parameter 2 (Time/sec) |
r |
Parameter 1 |
Parameter 2 (Time/sec) |
r |
|
Us |
t1k |
0.161 |
Us |
t0.8k |
|
|
Ul-Us |
t1k |
-0.271 |
Ul-Us |
t0.8k |
|
|
Tl-Ts |
t1k |
0.200 |
Tl-Ts |
t0.8k |
|
|
Jl-Js |
t1k |
-0.160 |
Jl-Js |
t0.8k |
|
|
Ul⁄Tl -Us⁄Ts |
t1k |
-0.515 |
Ul⁄Tl -Us⁄Ts |
t0.8k |
-0.647 |
|
(Ul⁄Tl -Us⁄Ts )/(Ul⁄Tl ) |
t1k |
-0.786 |
(Ul⁄Tl -Us⁄Ts )/(Ul⁄Tl ) |
t0.8k |
-0.779 |
|
(Ul⁄Tl -Us⁄Ts )/(Ul⁄Tl )-0.001(24-BMI) |
t1k |
-0.787 |
(Ul⁄Tl -Us⁄Ts)/(Ul⁄Tl )-0.001(24- BMI ) |
t0.8k |
-0.768 |
|
U_r-Us |
t1k |
-0.435 |
U_r-Us |
t0.8k |
|
|
U_r⁄T_r -Us⁄Ts |
t1k |
-0.356 |
U_r⁄T_r -Us⁄Ts |
t0.8k |
-0.987 |
|
U50-U0 |
t1k |
-0.384 |
U50-U0 |
t0.8k |
|
|
U50⁄T50 -U0⁄T0 |
t1k |
-0.395 |
U50⁄T50 -U0⁄T0 |
t0.8k |
|
|
(U50⁄T50 -U0⁄T0 )/(U50⁄T50 ) |
t1k |
-0.688 |
(U50⁄T50 -U0⁄T0 )/(U50⁄T50 ) |
t0.8k |
-0.959 |
We believe that long-run times for certain distances (i.e.1000 m) are more representative of heart function than the 6MWT method[26]. In the case of the participants putting their best effort when running such distances, the shorter the time, the stronger the heart function. The U wave amplitude Us from the V3 lead is less correlated with the running time t1k, as shown in Table 3(r=0.161). This is inconsistent with the traditional view[4]. Therefore, it cannot be that myocardial function must be good for anyone with more apparent U waves. This is because skinny people with weaker heart function (smaller BMI) can also have higher U wave amplitudes due to the small distance between the heart and the chest wall. However, (Ul-Us) has a slightly greater relationship with t1k(r=-0.271) if differences in electrical parameters are also deducted. The difference between the U wave and T wave amplitude ratio, such as (Ul⁄Tl-Us⁄Ts ), has a higher relationship with t1k (r=-0.515). If changes in body structure (changes in heart position and changes in chest impedance due to changes in body fluid distribution) during postural conversion are deducted, (Ul⁄Tl -Us⁄Ts )/(Ul⁄Tl ) should be compared with t1k; the correlation coefficient can then change to r=-0.786. If the impact from BMI is also deducted, the correlation coefficient will change to r=-0.789 (see Figure 9). A similar correlation also exists between (U50⁄T50 -U0⁄T0 )/(U50⁄T50 )and t1k(r=-0.688 ,see Figure 10). Therefore, after reducing the distance between the heart and the chest wall by changing the body position or compressing the chest, cardiac contractility can be estimated according to the obtained parameter combination. This method can be used in group examinations of healthy individuals, sports team selections, and sports performance correction/evaluation, etc. It is an innovation of the electrocardiogram for evaluating cardiac function.
In many instances, heart function and size of individuals aren’t known in advance. If one knows his/her U or T wave as well as their peak time difference by changing their body positions or by compressing the chest region, there are two possibilities: strong contractility or an unusually large heart. If the former possibility is basically ruled out based on factors like age, physical condition, degree of participation in exercise and BMI index, it indicates that his/her heart is abnormally large. This method is more objective and reliable compared to judging the size of the heart by palpating the apex of the heart[18], and it can serve as a method for quantitative diagnosis. Conversely, if it is confirmed that the size of the heart is within the normal range through methods such as X-rays, the value of the aforementioned parameter combination is directly related to the heart function.
This clinical trial basically confirmed our hypothesis regarding the U wave formation mechanism. Various strange phenomena related tothe U wave can thus be explained according to this hypothesis:
• Why is the U wave amplitude inversely proportional toheartrate? When heartrate is low, the heart needs to pump a greater volume of blood, and the left ventricle needs to contract more strongly; the apex pulse increases and (subsequently) U wave amplitude would increase.
• Why is the U wave amplitude in patients with ventricular hypertrophy higher? This is because the distance between the heart and the chest wall is reduced (if heart function is impeded by an increase in heart volume, however, the U wave may not increase).
• Why do the effects of some drugs including digitalis make the U wave amplitude increase? These drugs can stimulate the heart to contract more vigorously, effectively resulting in a stronger apex beat than that with no drugs.
• Why does the U wave amplitude increase in patients with severe anemia or hypothermia? This is due to homeostasis and instinctive reflexes, both of which require the heart to work more vigorously to ensure sufficient blood flow required by the body and sufficient heat production.
• Why does forced inhalation cause the U wave amplitude to increase? The diaphragm, when contracting upon inhalation, causes a decrease in distance between the heart and chest wall.
• Why does the U wave amplitude increase right after exercise? During exercise, the heart exhibits more “severe” contraction than when in the calm state.
• Why does raising thighs when in the supine position cause U wave amplitude to increase? This is because the thighs compress the chest cavity and shorten the distance between the heart and the chest wall.
• Why are males’ U waves higher than those of females? Similarly, why are those in younger people higher than those of the elderly and children? Why are ones of athletes higher than those of others? In all of these, the former has relatively stronger cardiac contraction.
• Why are the U waves of some skinnier people higher than those of “ordinary” people? They tend to have a closer distance between their heart and chest wall.
• Why does the U wave have a unique shape compared to that of the T wave? This is because U waves are the result of rapid apical impact on the chest wall, and the deformation of apical cells is sudden (high strain rate). Their repolarization process is quickly prevented, which causes a rapid rise and subsequent slow decline in U wave amplitude. The repolarization of the cells that aren’t affected by the apical beat is a mode that gradually advances from the endocardium to the epicardium, so the shape of the U wave and the T wave are exactly the opposite.
Our statistics only utilized the data fromthe V3 lead. The data from leads V2, V4 and V5 had similar patterns/trends in the data, andthe data of V1 and V6 and the “limb” leads need further analysis. This article is aimed only at healthy adolescents, and the number of participating women was small. In the future, it would be necessary to expand the target range of such clinical trials to middle-aged and elderly people, with potentially heart function problems.
Conclusion
Due to the apex beat, some left ventricular myocardial cells undergo deformation. When the amount of deformation and deformation rate exceeds a certain value, the repolarization process of these cells will be delayed, which leads to the generation of U waves in ECG. Changing the position or squeezing the chest to shorten the distance between the chest wall and the heart can increase the number of myocardial cells with delayed repolarization during the apical beat, which is manifested by an increase in U wave amplitude. Correspondingly, the amplitude of the T wave will decrease, and the time of the U wave peak will be delayed.
The ratios of the U wave and T wave amplitudes in different positions are strongly correlated.
There is a significant difference in the U wave amplitude of ECG between the supine and sitting positions.
U wave amplitude has little correlation with BMI index.
U waves and T waves can be changed by changing body positions or squeezing the chest. After deducting differences in electrical parameters, changes in thoracic tissue, changes in heart rate, and body factors, there is a clear inverse relationship between the change in the U wave, T wave amplitude ratios and the running at a certain distance.
Acknowledgements
This study was approved by the IRB (IRB #: 120190140). The study is supported by Princeton International School of Mathematics and Science.
Disclosures: None
References
- 1. M. S. Al-Karadi., Wilkinson, A. J., Caldwell, J., et al. Validation of an algorithm to reveal the U wave in atrial fibrillation. (2018) Scientific Reports 8.
Pubmed| Crossref| Others
- 2. Rautaharju, P. M., Surawicz, B.,Gettes, L. S., et al. AHA/ACCF/HRS Recommendations for the Standardization and Interpretation of the Electrocardiogram. Part IV: The ST Segment, T and U Waves, and the QT interval a scientific statement from the American Heart Association. (2009) J AmCollCardiol. 53(11): 982–991.
- 3. Giuseppe Di,Stolfo.,Mastroianno, Sandra., Maggio, Angela., et al. Electrical Remodeling of Ventricular Repolarization Abnormality after Treatment in Pheochromocytoma: U Wave Finding in a Retrospective Analysis. (2019) BioMed Research Int: 9.
- 4. Pérez Riera, A. R., Ferreira, Celso., Ferreira Filho, Celso., et al. The enigmatic sixth wave of the electrocardiogram The U wave. (2008) Cardiol J 15(5): 408–421.
- 5. Hannibal. Gerard B., The Mysterious U Wave. (2016) AACN AdvCrit Care 27(3): 344-346.
Pubmed| Crossref| Others
- 6. Surawicz, B. U wave: facts, hypotheses, misconceptions, and misnomers. (1998) J CardiovascElectrophysiol9(10):1117-1128.
- 7. Ritsema van, E. c. k., Kors, J.A., Herpen, G. V. The U wave in the electrocardiogram: a solution for a 100- year old riddle. (2005) Cardiovasc Res 67(2):256-262.
- 8. Eyer, K. Support for a mechanico-electrical source of the “U” wave. (2015) J Electrocardiol48(1):31-32.
Pubmed| Crossref| Others
- 9. Schimpf, R., Antzelevitch, C., Haghi, D., et al. Electromechanical coupling in patients with the short QT syndrome: further insights into the mechanoelectrical hypothesis of the U wave. (2008) Heart Rhythm 5(2):241-245.
Pubmed| Crossref| Others
- 10. Bernardo, Diego Di., Murray Alan. Origin on the electrocardiogram of U-waves and abnormal U-wave inversion. (2002) Cardiovascular Res 53(1): 202-208.
- 11. Kenneth,Eyer. Support for a Mechanico-Electrical Source of the “U” Wave. (2015) J Electrocardiol 48 (1): 31-32.
Pubmed| Crossref| Others
- 12. Adams, M.G., Drew, B.J. Body position effects on the ECG: implication for ischemia monitoring. (1997) J Electrocardiol30(4): 285–291.
- 13. Shinar, Z., Baharav, A., Akselrod, S. R. wave duration as a measure of body position changes during sleep. (1999) ComputCardiol26: 49-52.
Pubmed| Crossref| Others
- 14. Shiner, Z., Baharav, A., Akselrod,S. Detection of different recumbent body positions from the electrocardiogram. (2003) Med BiolEngComput41(2): 206-210.
Pubmed| Crossref| Others
- 15. Batchvarov, V.N., Bortolan, G., Christov, I.I. Effect of heart rate and body position on the complexity of the QRS and T wave in healthy subjects. (2008)Com Cardiol: 225–228.
Pubmed| Crossref| Others
- 16. Smit, D., Cock, C.C.D., Thijs, A., et al. Effects of breath-holding position on the QRS amplitudes in the routine electrocardiogram. (2009) J Electrocardiol42(5): 400.
- 17. Lying position classification based on ECG waveform and random forest during sleep in healthy people.(2018) Biomed Eng Online 17: 116.
- 18. Supreet,Khare.,Anuj, Chawala. Effect of change in body position on resting electrocardiogram in young healthy adults. (2016) Nigerian J Cardiol 13(2): 125-129.
Pubmed| Crossref| Others
- 19. Ng, J., Sahakian, A. V., Swiryn, S., et al. The effect of body position on P-wave axis. (2001) Heart Lung Circ28.
Pubmed| Crossref| Others
- 20. Mase, K., Noguchi, T., Tagami, M., et al. Compression of the lungs by the heart in supine, side-lying, semi-prone positions. (2016) J PhysTherSci28(9): 2470-2473.
Pubmed| Crossref| Others
- 21. Albert, R.K., Hubmayr, R.D. The prone position eliminates compression of the lungs by the heart. (2000) Am J RespirCrit Care Med 161(5): 1660-1665.
- 22. Ball, W.S., Wicks, J.D., Mettler, F.A. Prone-supine change in organ position: CT demonstration. (1980) AJR 135(4): 815-820.
Pubmed| Crossref| Others
- 23. Lindroos, M., Kupari, M., Heikkilä, J., et al. Echocardiographic evidence of left ventricular hypertrophy in a general aged population. (1994) Am J Cardiol74: 385-390.
- 24. Ehara, S.,Shirai, N., Matsumoto, K., et al. The clinical value of apex beat and electrocardiography for the detection of left ventricular hypertrophy from the standpoint of the distance factors from the heart to the chest wall: a multislice CT study. (2011) Hypertens Res 34(9): 1004-1010.
Pubmed| Crossref| Others
- 25. Horton, J.D., Sherber, H.S., Lakatta, E.G. Distance correction for precordial electrocardiographic voltage in estimating left ventricular mass: an echocardiographic study. Circulation. (1977) 55(3):509–512.
- 26. ATS Statement: Guidelines for the Six-Minute Walk Test. (2002) Am J RespirCrit Care Med 166(1): 111–117.
Pubmed| Crossref| Others
- 27. Swathi Karanth, M.P.,Awad N. T. Six Minute Walk Test: A Tool for Predicting Mortality in Chronic Pulmonary Diseases. (2017) J ClinDiagn Res 11(4): OC34–OC38.
Pubmed| Crossref| Others


