Creatine Monohydrate: Daily Blood Pressure Monitoring During the Loading Phase of Supplementation
Affiliation
Department of Exercise & Rehabilitative Sciences, Exercise Physiology Laboratory Health, Winona State University, Winona, Minnesota 55987, USA
Corresponding Author
Gary M. Kastello, Ph.D, Department of Exercise & Rehabilitative Sciences, Exercise Physiology Laboratory Health, Winona State University, Winona, Minnesota 55987, USA, Tel: (507) 457-5219; Fax: (507) 457-2554;E-mail: GKastello@winona.edu
Citation
Kastello, G.M., et al. Creatine Monohydrate: Daily Blood Pressure Monitoring During the Loading Phase of Supplementation. (2015) Int J Food Nutr Sci 2(2): 147-152.
Copy rights
©2015 Kastello, G.M. This is an Open access article distributed under the terms of Creative Commons Attribution 4.0 International License.
Keywords
fluid shift, blood volume, active ROM
Abstract
Creatine monohydrate (CrM) is considered a safe nutritional supplement. The loading phase of CrM supplementation is associated with shifts in total body water and plasma volume that may affect blood pressure. However, few studies have measured blood pressure during the loading phase of CrM supplementation.
Purpose: The aim of this study was to determine if CrM supplementation in normotensive college-aged males induces a daily blood pressure increase during the supplementation-loading phase.
Methods: Participants’ blood pressure, shoulder extension active range of motion (AROM), arm girth, arm volume, plasma volume, blood volume, hematocrit, and hemoglobin were measured daily for five days of supplementation (4x5gxd-1x5d) of either CrM (n = 12) or placebo (P; n = 12).
Results: The CrM group did not experience significant changes in systolic blood pressure (mmHg) (CrM 126.67 ± 1.94Day5; P 125.50 ± 2.61Day5) or diastolic blood pressure (mmHg) (CrM 83.83 ± 2.19Day5; P 82.33 ± 2.07Day5) compared to P. A significant T x Tx interaction (p = 0.001) and Tx effect (p = 0.03) support decreased AROM (cm) in the CrM group compared to P (CrM 38.3 ± 2.19Day1, CrM 34.0 ± 2.01Day5; P 41.02 ± 2.49 Day1, P 43.2 ± 2.47Day5). An increase in arm volume (ml) in the CrM group (CrM 2443 ± 99.44Day1, CrM 2470 ± 92.21Day5) vs. the P group (P 2372 ± 74.44Day1, P 2374 ± 74.61Day5; p = 0.026) was observed. An increase in plasma volume (%Δ from baseline) (p = 0.014) (CrM 1.48 ± 2.60Day2, CrM 6.03 ± 4.03Day5; P 3.25 ± 2.74Day2, P 5.05 ± 2.91Day5) and a decrease in hematocrit (%) (p = 0.026) (CrM 0.47 ± 0.01Day1, 0.45 ± 0.01Day5; P 0.46 ± 0.01Day1, 0.45 ± 0.01Day5) were observed.
Conclusion: Findings suggest CrM supplementation in the loading phase does not affect blood pressure in normotensive college-aged males. CrM reduces shoulder extension AROM presumably due to increased tissue volume secondary to fluid shifts.
Introduction
In the recent years, creatine monohydrate has become a very popular nutritional supplement. Naturally found in most protein foods, such as red meat, poultry, or fish, creatine aids in ATP turnover and delays depletion of phosphocreatine. Studies show that creatine monohydrate (CrM) has ergogenic benefits such as improved strength, body composition, and muscle hypertrophy[1,2]. Based on several studies on the safety and efficacy of CrM ingestion, it is considered to be a “safe” nutritional supplement[3]. However, several anecdotal reports have associated CrM ingestion with muscle cramping, gastrointestinal distress, and kidney dysfunction and heart illness.
CrM supplementation has two phases, a loading and a maintenance phase. Loading is of particular interest because it typically consists of supplementing 20-25g d-1 for 5-7 days, which is a much higher dosage than ingested during the maintenance phase. Several studies have demonstrated that the loading phase is directly associated the weight gains experienced from CrM. This can be explained by water-retaining characteristics of CrM during the loading phase[4-6,2]. When skeletal muscles absorb ingested creatine, an osmotic gradient between the blood source and intracellular fluids is created; ultimately drawing water into the cells, increasing total body water[2]. One study found that the significant increase in total body water from CrM supplementation did not alter total body fluid distribution[7]. Therefore, increases in total body water can increase both extracellular and intracellular fluid leading with a commensurate rise in blood volume. Small changes in blood volume can cause increases in blood pressure based on a basic physiologic pressure-volume relationship[8].
Some studies have shown that initial increases in fluids do not alter arterial pressure immediately due to the tight regulation by the baroreceptors[8,9]. Several classic studies utilizing dogs demonstrated that an increase in water and salt intake 5-6 fold led to an immediate increase in extracellular fluid, cardiac output, and blood volume. Total peripheral resistance decreased due to baroreceptor activation, which allowed for only a small increase in arterial pressure. However, after 1-2 days of increase fluids, the baroreceptors “adapted” to the increase arterial pressure. This led to an increase in total peripheral resistance resulting in an increase in arterial pressure[10].
The initial increase in fluid volume is associated with the loading phase of CrM supplementation; as the maintenance phase does not have the same impact on fluid distribution[5-7,11]. Therefore, the kidney fluid regulatory system will eventually counter fluid increase during the end of the loading phase within 3-5 days by excreting more water and salt, allowing for a decrease in extracellular volume and a return to homeostasis[8].
Five studies have found no significant change in arterial pressure before and after the loading phase of CrM supplementation[1,4,12-14]. However, these studies did not measure the arterial pressure daily during the loading phase; hence any changes in arterial pressure may have gone undetected. To our knowledge, no studies have measured arterial pressure daily during the loading phase, when the largest fluids shifts occur Therefore, the purpose of this study is to determine if CrM’s water retaining characteristic will induce a daily change in arterial pressure based on a fluid increase during the loading phase of CrM in normotensive college-age males. An increased arterial pressure could be harmful for borderline hypertensive athletes who supplement with CrM.
Materials and Methods
Experimental Approach to the Problem
The purpose of the experimental design was to address potential increases in BP due to acute CrM supplementation. Supplementation was designed to mimic a typical loading phase. Participants were assigned to ingest either a CrM supplement (CrM) (n = 12) or placebo (P) (n = 12) in a randomized, P controlled, repeated measures double blind design. Participants supplemented for 5 days. The P contained Benefiber cellulose (Novartis Consumer Health; Basel, Switzerland) & sucrose in a 1:1 ratio. The CrM supplement contained CrM (USA Labs; Burns, TN) and sucrose in a 1:1 ratio. Both supplements were visually identical. The supplement was packaged into four 10g doses per day (morning, noon, dinner, and before bed). The P or CrM was dissolved into 16 ounces of water and ingested. Participants filled out a three-day nutritional recall, medical history, informed consent, and physical activity form.
Subjects
The double blind, randomized, placebo-controlled study consisted of 24 non-trained or moderately trained (< 3 days * week-1) men who were randomly assigned to a CrM supplementation group (n = 12) or a placebo (P) group (n = 12). Physical characteristics (± SE) for age, weight, and % body fat were measured (Table 1.) Participants were instructed to refrain from lifting weights at least three days prior to testing. Exclusion criteria included any participants who suffered from kidney or liver disease, inflammatory diseases, high blood pressure, smoking or were taking prescription medications. All participants were advised to cease ingestion of any supplements, including vitamins, minerals, amino acids, aspirin, ibuprofen and alcohol as well as refrain from sauna exposure. Participants signed a WSU Institutional Review Board approved informed consent.
Table 1: Anthropometric measurements of CrM and P groups with means ± SE. There are no significant differences between groups.
| CM(n = 12) | P(n = 12) | |
|---|---|---|
| Age (years) | 20.33 ± 0.43 | 21.17 ± 0.84 |
| Height (cm) | 181.30± 1.61 | 183.72 ± 2.01 |
| Weight (kg) | 85.12 ± 4.66 | 84.78 ± 3.52 |
| % Body Fat | 15.36 ± 1.86 | 13.10 ± 1.71 |
Supplementation
The supplement administration consisted of 4x10g*d-1 x 5d of either CrM & sucrose (1:1) or P (sucrose & benefiber cellulose 1:1). All participants were required to submit a medical history form, informed consent, and a daily diet and physical activity recall. An overnight fast was required during all days of supplementation with only water and one serving of the supplement prior to testing each morning.
Procedure
Blood Pressure: On arrival, participants rested in a seated position for 5-minutes prior to testing. A sphygmomanometer cuff (Trimline™, Skaneateles Falls, NY) was placed over the participant’s right bicep, approximately 2 inches proximal to the antecubital space. A dual-head stethoscope (3M™ Littmann®, St. Paul, MN) was placed over the brachial artery. Two technicians documented values for accuracy and average values were recorded. If pressure varied by more than 2 mmHg between technicians, a second reading was recorded after another 5-minutes of rest.
Hematocrit: Each day using a standard finger prick (Surgilance Safety Lancet, Medi Purpose; Duluth GA) to collect blood sample, the concentration of Hb was determined spetrophotometrically (Milton Roy Spectronic 601 Spectrometer, Ivyland PA) at 540nm based on a standard curve (Hainline, 1958). Hct was determined by centrifuging a 75ul Drummond Hemato-Clad Heparinized Hematocrit tube (Drummond Scientific Company; Broomall, PA) for 5-minutes. Blood volume (BV), cell volume (CV), plasma volume (PV), ΔBV%, ΔCV%, and the ΔPV% were determined using the following equations[15].
BVA= BVB (HbB/HbA) CVA=BVA (HctA)
PVA=BVA -CVA
ΔBV, % = 100 (BVA – BVB)/BVB
ΔCV, % = 100(CVA-CVB)/CVB
ΔPV, % = 100(PVA-PVB)/PVB
Total Body Water: Body weight, total body water, and percent fat were determined using a bioelectrical impedance scale (Tanita BF-683W; Corporation of American, Inc.; Arlington Heights, Illinois). Each participant’s height, age, and activity level (active mode was used for all participants) was programmed into the scale. Participants were only allowed to wear shorts and t-shirts for this procedure.
Arm Volume: Participant was instructed to stand adjacent to the volumeter (Dynatronics, Salt Lake City) and slowly submerge right arm until the middle finger touched the positioning bar. Displaced volume was collected via graduated cylinder. Arm volume trials were completed in duplicate. If the volumes varied by more than 20 mL, additional trials were completed until the difference was < 20 mL.
Arm Girth: Marks were made at 1/3 and 2/3 the distance from the acromion process to the olecranon process landmarks on the posterior arm. Girth was measured at each mark using a constant tension tape (Creativ Health Products, Ann Arbor, MI). Measurements were taken in duplicate and averaged. If measurements varied by more than 2 mm, additional trials were completed until measurements varied < 2 mm.
Arm Extension: Two trials of active and passive range of motion were measured while the participant lay on table in the pronated position with extended elbows and palms facing up. Active ROM was determined when the participants lifted the arm as high as possible, while the technician measured from table to styloid process using a rigid ruler. Passive ROM was measured with technician lifting participants arm to a maximal height that was still within the participants comfortable range. If values from the trials varied by more than 2cm, additional trials were completed until two trials were within 2cm.
Statistical Analysis
SPSS (version 11) was used to analyze statistical differences among groups. A repeated ANOVA [between factors: CrM vs. P] was used to compare dependent variables. Independent student t-tests were performed to_determine any group differences in nutritional intake. Data are expressed as mean ± SE for all statistical tests; the alpha level was set at 0.05. Figures display baseline measurements as Day 1 and supplementation data as Day 2,3,4,5.
Limitations
Although nutritional and exercise limitations were imposed on participants, and a nutritional assessment was completed, the accuracy is limited by participant recall. Additionally, the sample size was limited to 12 per group in the current study, a large sample size would be expected to decrease statistical variation which in turn would improve overall statistical power for group comparisons.
Results
Nutrition (Table 2): After accounting for differences in body mass (kg), no nutritional differences between the CrM and P groups were observed (p > 0.05).
Table 2: Nutritional differences for the CrM and P groups with means ± SE.There are no significant differences between groups.
| CM(n = 12) | P( n= 12) | |
|---|---|---|
| Total Kcal (kcal •kg-1•day-1) | 31.72 ± 4.57 | 31.09 ± 2.55 |
| CHO(kcal •kg-1•day-1) | 13.75 ±1.57 | 13.49 ± 1.47 |
| PRO (kcal •kg-1•day-1) | 5.61± 0.85 | 5.10 ± 0.39 |
| FAT(kcal •kg-1.day-1) | 10.50 ± 1.83 | 11.12 ± 1.26 |
| Vit. A(iu•kg-1•day-1) | 10.95 ± 4.05 | 12.36± 3.14 |
| Vit. C (mg•kg-1•day-1) | 1.00 ± 0.22 | 0.98 ± 0.21 |
| Vit. E (mg•kg-1•day-1) | 0.07± 0.02 | 0.09 ± 0.01 |
| Iron (mg•kg-1•day-1) | 0.19 ± 0.03 | 0.24 ± 0.03 |
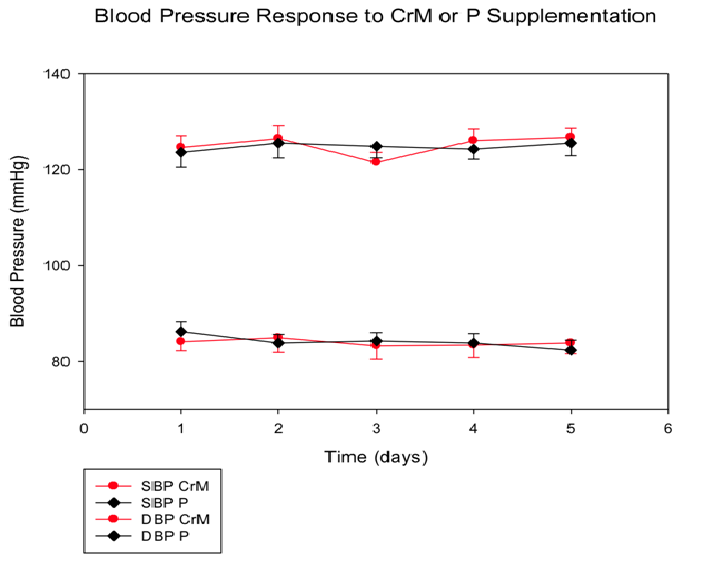
Arterial Pressure (Figure 1): SBP (mmHg) remained constant for the CrM group from baseline measurement (124.58 ± 2.37)day 1 to (126.67 ± 1.94)day 5 similar to the P (123.58 ± 2.90) day 1 to (125.50 ± 2.61)day 5. There was no significant time effect (p = 0.136), Tx effect (p = 0.925) or T x Tx interaction (p = 0.309). DBP (mmHg) also remained constant from CrM (83.83 ± 2.19) day 5 to P (82.33 ± 2.07)day 5. There was no significant time effect (p = 0.415), Tx effect (p = 0.949) or T x Tx interaction (p = 0.293).
Figure 1: Systolic blood pressure (SBP) and diastolic blood pressure (DBP)response to CrM or P supplementation in college-aged males. Data points are means ± SE expressed in mmHg.There are no significant differences between groups at any time point.
Mean Arterial Pressure (mmHg): There was no significant change across time in CrM group from baseline measurement (99.17 ± 7.93)day1 to (97.86 ± 6.77)day5. There was also no change in the placebo group from baseline (97.06 ± 5.83)day1 to day 5 (96.97 ± 5.50)day5.
Active Range of Motion (Figure 2): AROM values decreased (cm) across time in the CrM group from (38.25 ± 2.19)day1 to (34.04 ± 2.01)day5, while the P group increased slightly from baseline (41.02 ± 2.49)day1 to (43.21 ± 2.47)day5. There was a significant Tx effect (p = 0.03) and a significant T x Tx interaction (p = 0.001). Specifically, there was a significant Tx effect (p = 0.01) at days, 3, 4 and 5. The biggest change between the two groups occurred on day 4 (Δ9.17 cm). There was no significant time effect (p = 0.71).
Figure 2: Active range of motion (AROM) response to four days of CrM or P supplementation in college-aged males.There was a significant T x Tx interaction (p=0.03) and treatment effects are denoted by * at days 3, 4, 5, with p=0.01, respectively
Passive Range of Motion (cm): There were no significant differences between the CrM (47.63 ± 1.89)day5 and P (48.54 ± 1.27) day5 groups once baseline variation was accounted for (p > 0.05).
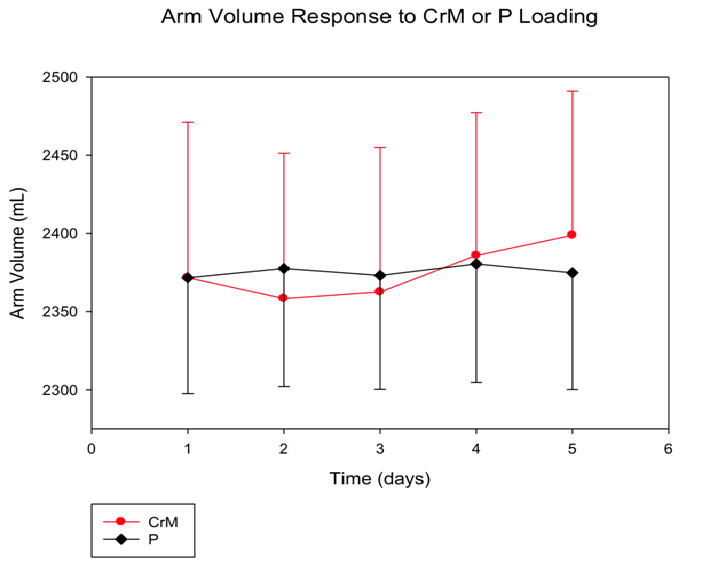
Arm Volume (Figure 3): There was a significant time effect (p = 0.012) and a significant T x Tx interaction (p = 0.026), as arm volume (mL) CrM increased across time from (2443.75 ± 99.44)day1 to (2470.83 ± 92.21)day5 compared to the P (2371.67 ± 74.44)day1 to (2374.79 ± 74.61)day5. There was no significant Tx effect (p = 0.553).
Figure 3: Arm volume response to four days of CrM or P supplementation in college-aged males after baseline differences are accounted for.Data points are means ± SE expressed in mL. There is a significant T x Tx interaction (p = 0.026) and T effect (p = 0.012).
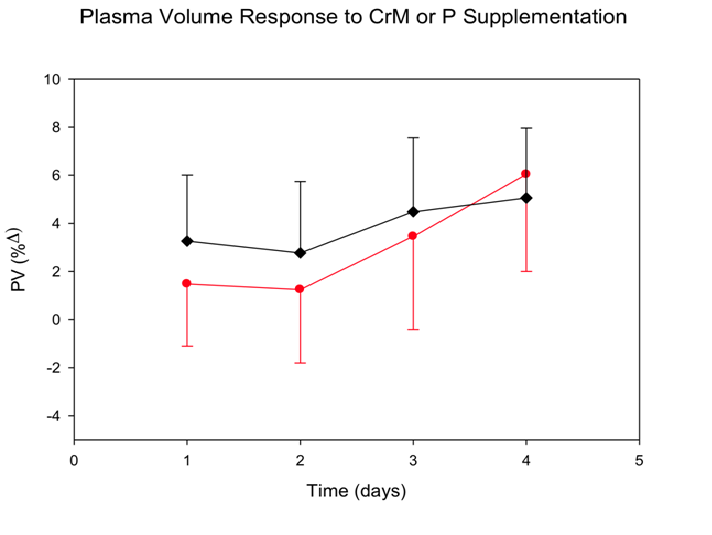
Plasma Volume (Figure 4): PV (% Δ) significantly increased in both groups across time (p = 0.01) on average from (2.37 ± 1.89)day2 to (5.54 ± 2.50)day5. No significant differences were found in plasma volume (T x Tx, p = 0.641) in CrM from (1.48 ± 2.60)day2 to (6.03 ± 4.03)day5 when compared to P from (3.25 ± 2.74)day2 to (5.05 ± 2.91)day5. No significant differences were found for Tx effect (p = 0.847).
Figure 4: Plasma volume (PV) response to four days of CrM or P supplementation in college-aged males. Data points are means ± SE expressed in %Δ from baseline. There was a significant T effect (p = 0.014).
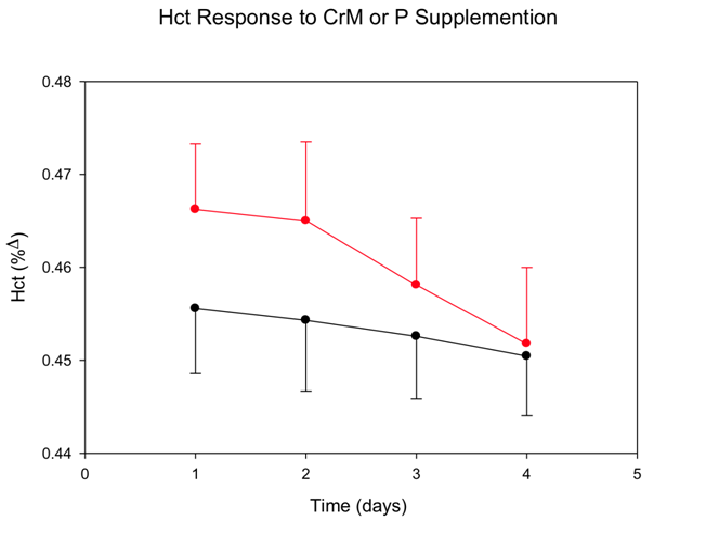
Hematocrit (Figure 5): No significant differences were found in hct. (%Δ) across time for CrM (0.47 ± 0.01)day1 to (0.45 ± 0.01)day5 when compared to P (0.46 ± 0.01)day1 to (0.45 ± 0.01)day5. A significant time effect was found (p = 0.03) as there was a decrease in both groups across time, from (0.46 ± 0.04)day1 to (0.45 ± 0.20)day5. There was no significant T x Tx interaction (p = 0.896).
Figure 5: Hematocrit (Hct) response to four days of CrM or P supplementation in college-aged males. Data points are means ± SE expressed in % Δ from baseline. There was a significant T effect (p = 0.026).
Blood and Red Cell Volume (% Δ): No significant differences in percent change were found for blood volume (BV), CM (1.02 ± 1.20)day5 and P (1.87 ± 1.03)day1 or red cell volume (CV), CM (-2.45 ± 2.09)day1 and P (-1.00 ± 1.29)day1. Additionally, no Tx effect, BV (p = 0.412) CV (p = 0.694), or T x Tx interaction was observed, BV (p = 0.059) CV (p = 0.794).
Hemoglobin (%Δ): No significant differences were found for hemoglobin (Hb) between CrM (22.59 ± 0.43)day5 and P (22.44 ± 0.34)day5. There were no significant time effect (p = 0.111), Tx effect (p = 0.785), or T x Tx interaction (p = 0.886).
Upper Arm Girth (cm): No significant differences in upper arm girth were found between CrM (35.35 ± 0.93)day5 and P (34.28 ± 0.92)day5. There was a significant time effect (p = 0.05), as both groups increased from baseline; however, neither group experienced Tx or T x Tx interactions, (p = 0.422) and (p = 0.058) respectively.
Lower Arm Girth (cm): There was a significant time effect (p = 0.035), as both groups increased from baseline, however there were no significant differences in T x Tx (p = 0.657) or Tx (p = 0.545) effect for lower arm girth between CrM (32.14 ± 2.76)day5 and P (31.44 ± 3.08)day5.
Total Body Water (%): No significant differences were found for a Tx effect (p = 0.260) or T x Tx interaction (p = 0.896). TBW was relatively stable across time for CM (59.09 ± 0.99)day1 to (59.00 ± 1.00)day5 and P (60.55 ± 1.01)day1 to (60.52 ± 0.99)day5.
Body Composition (% fat) (Table 1): There was no significant difference in body composition between the CrM (15.57 ± 1.91 %)day 5 and P (12.61 ± 1.60 %)day5 groups across time (p = 0.20). There was no Tx effect (p = 0.347) or T x Tx interaction (p = 0.245).
Weight (kg) (Table 1): Body weight did increase across time (T, p = 0.002), in both groups; CrM from baseline (85.14 ± 4.66 kg)day1 to (86.04 ± 4.61 kg)day5 and P (84.78 ± 3.52)day1 to (85.37 ± 3.52)day5. No significant Tx effect (p = 0.942) or a T x Tx interaction (p = 0.521) were observed.
Discussion
Studies reviewing the safety and efficacy of CrM have found it to be considered a “safe” nutritional supplement with weight gain as the only direct side effect[3,6,7,9,11,13,14]. This increase in weight occurs during the loading phase of supplementation (20-25 g x d-1) and can be partially attributed to the water retaining characteristics of CrM, which directly increases total body water[2,9,14,16,17].
The CrM associated increase in TBW has been accompanied with an increase in BV, presumably due to increases in plasma volume[18]. A classic study by Guyton et al. supports small increases in fluid volumes can have large arterial pressure increases. Guyton found the largest increase was present one to two days after the fluid shift[11]. During the loading phase of CrM supplementation, the largest fluid change is present one to two days after the initial loading dose is taken. An increase in fluids in the body would increase blood volume, which ultimately could increase arterial pressure.
Given the documented increase in TBW and BV associated with acute CrM supplementation, it is of interest to measure arterial pressure daily during the loading phase of supplementation. In the present study the researchers wanted to quantify increases in fluids caused by CrM supplementation and its affect on arterial pressure. Five existing studies were found in which arterial pressure was not affected following the loading phase of CrM supplementation[1,2,8,10,12]. However, none of these studies collected arterial pressure data daily as it was only recorded before and after the loading phase[10].
With previous studies only measuring blood pressure before and after the loading phase, any changes between those measurements may have gone undetected. The uniqueness of the present study was the determination of daily blood pressure during the CrM loading phase of supplementation in normotensive college-aged males. The current study found no changes in systolic or diastolic pressure between the two groups (Figure 1), even when BP was recorded on a daily basis during the loading phase. These results are consistent with other studies that only measured BP before and after the loading phase of CrM supplementation[1,2,8,10,12].
Arterial pressure is tightly regulated within the body. With the help of short-term and long-term regulators, the fluid shifts caused by the osmotic properties of creatine were not great enough to induce an increase in arterial pressure. Regulators of blood pressure that may have kept arterial pressure at homeostasis include baroreceptors, natural distensibility of blood vessels, and the rennin-angiotensin-aldosterone system[11,19]. Despite a slight increase in blood volume in the present study, it was not great enough cause a blood pressure increase[11,19].
The present study found an increase in PV (p = 0.01) with a decrease in hematocrit (p = 0.03) across time in both groups, which supports an increase in intravascular fluids. Since PV is a component of ECW, this finding was expected for the CrM group. In contrast, this was not expected for the P group, and could be the result of increased water intake as all participants were instructed to ingest each supplement with 16oz. of water (64oz. day-1 x 4d). As total body water (TBW) consists of 1/3 extracellular fluid (ECW) and 2/3 intracellular fluid (ICW), the present study found no change in TBW despite an increase in intravascular fluids. Powers et al. demonstrated that CrM supplementation resulted in increased TBW while maintaining normal fluid distribution[3,17]. The underlying finding from the Powers study supports an increase ECF volume with CrM supplementation. The current study also supports an increase in ECW. Other studies have observed increased ICW following CrM supplementation with concomitant declines in ECW[14,20]. With CrM being osmotically active, it can have dehydrating effects when consumed with minimal fluids. These differences can be explained by different fluid consumption throughout the loading phase.
Secondary to these fluid shifts, shoulder extension AROM decreased (time x Tx, p = 0.001), and arm volume increased (time x Tx, p = 0.026) in the CrM group. The increase in intravascular fluids in the arm subsequently could have led to the AROM 11% average decrease in the current study. With more fluids around the joint, it may have hindered the participants’ ability to reach full AROM. Sculthorpe, et al. also observed a significant decline in AROM and suggested two theories to explain it[15]. The first stated that CrM increased ICW content of muscle leading to muscle stiffness, and increased resistance to muscle stretch[15]. The second theory suggests that CrM induced changes in muscle cell volume may affect neural outflow[15]. More specifically, as muscle spindles take in creatine they would also take in more water, leading to a change in cell volume[15]. This change would then cause a muscle spindle reflex, inducing an early contraction in the agonist muscle opposing the stretch, and result in a decrease ROM[15].
In conclusion, the results of the present study suggest that acute CrM supplementation does not induce a daily arterial pressure change in normortensive college-aged males. However, it does decrease AROM presumably do to secondary ECW fluid increases.
Practical Applications
Since creatine monohydrate is a common nutritional supplement in athletic activities, it is important to understand its physiological effects. The results of this study have found no significant change in blood pressure during the loading phase of supplementation; supporting creatine supplementation as a safe practice regarding blood pressure changes for normotensive college-aged males. With shoulder extension AROM decreasing in the present study, this can be an unfavorable side effect for athletes involved in activities where AROM is essential for performance
Acknowledgment
We thank the Alumni Association at Winona State University for funding this project. We received no external source of funding for this project, and have no affiliation with any corporation that produces or sells creatine monohydrate supplements.
References
- 1. Chang, C.T., Wu, C.H., Yang, C.W., et al. Creatine monohydrate treatment alleviates muscle cramps associated with haemodialysis. (2002) Nephrol Dial Transplant 17(11): 1978-1981.
- 2. Sculthorpe, N., Grace, F., Jones, P., et al. The effect of short-term creatine loading on active range of motion. (2010)Appl Physiol Nutr Me 35: 507-511.
- 3. Powers, M.E., Arnold, B.L., Weltman, A.L., et al. Creatine supplementation increases total body water without altering fluid distribution. (2003)J Athl Train 38: 44-50.
- 4. Hile, A.H., Anderson, J.M., Fiala, K.A., et al. Creatine supplementation and anterior compartment pressure during exercise in the heat in dehydrated men. (2006) J Athl Train 41(1): 30-35.
- 5. Thrasher, T.N. Baroreceptors, baroreceptor unloading, and the long-term control of blood pressure. (2005) Am J Physiol Regul Integr Comp Physiol 288(4): R819-827.
- 6. Schilling, B.K., Stone, M.H., Utter, A., et al. Creatine supplementation and health variables: a retrospective study. (2001) Med Sci Sports Exerc 33(2): 183-188.
- 7. Poortmans, J.L., Kumps, A., Duez, P., et al. Effect of oral creatine supplementation on urinary methylamine, formaldehyde, and formate. (2005) Med Sci Sports Exerc 37(10): 1717-1720.
- 8. Guyton, A.C. Blood pressure control-special role of the kidneys and body fluids. (1991) Science252(5014): 1813-1816.
- 9. Terjung, R.L., Clarkson, P., Eichner, R.E., et al. The physiological and health effects of oral creatine supplementation. (2000) Med Sci Sports Exerc 32: 706-717.
- 10. Guyton, A.C. Roles of the kidneys and fluid volumes in arterial pressure regulation and hypertension. (1989) Chin J Physiol 32(2): 49-57.
- 11. Graham, A.S., Hatton, R.C. Creatine: a review of efficacy and safety. (1999)J Am Pharm Assoc 39(6): 803-810.
- 12. Armentano, M.J., Brenner, A.K., Hedman, T.L., et al. The effect and safety of short-term creatine supplementation on performance of push-ups. (2007) Mil Med 172(3): 312-317.
- 13. Mihic, S., MacDonald, J.R., McKenzie, S., et al. Acute creatine loading increases fat-free mass, but does not effect blood pressure, plasma creatinine, or CK activity in men and women. (2000) Med Sci Sports Exerc 32(2): 291-296.
- 14. Volek, J.S., Mazzetti, S.A., Farquhar, W.B., et al. Physiological responses to short-term exercise in the heat after creatine loading. (2001) Med Sci Sports Exerc 33(7): 1101-1108.
- 15. Dill, D.B.,Costill, D.L. Calculation of percentage changes in volumes of blood, plasma and red cells in dehydration. (1974)J Appl Physiol 37(2): 247-248.
- 16. Volek, J.S., Kraemer, W.J., Bush, J.A., et al. Creatine supplementation enhances muscular performance during high intensity resistance exercise. (1997) J Am Diet Assoc 97(7): 765-770.
- 17. Weiss, B.A., Powers, M.E. Creatine supplementation does not impair the thermoregulatory response during a bout of exercise in the heat. (2006) J Sport Med Phys Fit 46(4): 555-563.
- 18. Hickner, H.C., Dyck, D.J., Sklar, J., et al. Effect of 28 days of creatine ingestion on metabolism and performance of a stimulated cycling road race. (2010) J Int Soc Sport Nutr 7: 26.
- 19. Drabkin, D.L. Hemoglobin. (1932) J Biol Chem 98: 719.
- 20. Ziegenfuss, T.M., Lowery, L.M., Lemon, P.W.R. Acute fluid volume changes in men during three days of creatine supplementation. (1998) J Ex Physiol 1(3): 1-7.


