Determinants of acute myocardial infarction of Worcester heart attack study
Affiliation
Department of Statistics, The University of Burdwan, Burdwan, West Bengal, India
Corresponding Author
Rabindra Nath Das, Ph. D., Professor, Department of Statistics, The University of Burdwan, Burdwan, West Bengal, India, E-mail: rabin.bwn@gmail.com
Citation
Das, R.N. Determinants of Acute Myocardial Infarction of Worcester Heart Attack Study. (2016) J Heart Cardiol 2(2): 87- 93.
Copy rights
© 2016 Das, R.N. This is an Open access article distributed under the terms of Creative Commons Attribution 4.0 International License.
Keywords
Blood pressure; Cardiogenic shock; Cardiovascular disease; Gamma model; Heart rate; Log-normal model; Non-constant variance
Abstract
Objectives: This article aims to identify the determinants of the Systolic Blood Pressure (SBP), Diastolic Blood Pressure (DBP) and the Heart Rate (HR) of the Acute Myocardial Infarction (AMI) patients in the Worcester Heart Attack Study (WHAS).
Background: Little is known about the determinants of SBP, DBP and HR of AMI patients in the WHAS.
Methods: The responses DBP, SBP and HR are positive with non-constant variances, so joint log-normal or gamma model fittings are appropriate for these responses.
Results: Mean DBP is inversely separately associated with age (P < 0.001), congestive heart complications (CHF) (P = 0.007) and Myocardial Infarction (MI) order (MIORD) (P = 0.054), and it is directly separately associated with HR (P < 0.001), SBP(P < 0.001), a trial fibrillation (AFB) (P = 0.072), cardiogenic shock (SHO) (P = 0.036), myocardial infarction (MI) type (MITYPE) (P < 0.001). Mean SBP is negatively separately associated with HR (P < 0.001), AFB (P = 0.011), SHO (P < 0.001), MITYPE (P < 0.001), and it is positively separately associated with age (P = 0.013), sex (P = 0.002), DBP (P < 0.001), history of cardiovascular disease (CVD) (P = 0.011). Mean HR is inversely separately associated with SBP (P < 0.001), history of cardiovascular disease (CVD) (P = 0.095), complete heart block (CV3) (P = 0.033), MITYPE (P < 0.001), cohort year (YEAR) (P = 0.032), and it is positively separately associated with AGE (P = 0.039), DBP (P < 0.001), CHF (P < 0.001).
Conclusions: Determinants of mean and variance of SBP, DBP and HR of AMI patients in the WHAS are derived in this report. Effects of these determinants on their responses are also derived. These derived effects are almost new in the WHAS literature.
Introduction
It is well-known that the hypertension is positively associated with stroke for 54%, and 47% of ischaemic heart disease[1]. In addition, it affects 30% of the adult population[2]. Generally, blood pressure, heart rate and hypertension are a very complex medical condition, and they practically exist together[1-3]. Generally, hypertension is managed by pharmacotherapy. In the market, lots of drugs are available for hypertension management, but the effective rate of any drug is approximately 50%[4]. There are several risk factors (such as family history, sleep apnoea, biochemical and lifestyle parameters) are associated with uncontrolled blood pressure. Note that the genetic effects and the intra-individual blood pressure variation have a great impact on the drug response[5,6]. Hypertension and cardiac risk factors for the patients who underwent dobutamine stress echocardiography have been studied recently in many articles[7-10].
In epidemiology, the main aim is to determine the risk factors of a disease. In clinical medicine, it is also important to identify the risk factors of a particular disease. Determinants of heart rate and blood pressures are identified in the earlier research articles using statistical tools, namely, analysis of variance, z-test, Chi-square test, regression analysis[11-14]. Note that the physiological data are generally heterogenous. Therefore, the earlier used approaches as mentioned above are not appropriate[ 15,16]. Moreover, there is very little study (based on our knowledge) of identifying the determinants of blood pressures and heart rate of AMI patients in the WHAS data set[17]. Generally, a positive data set (which takes always positive values) is analyzed using gamma or log-normal model[16,18,19]. For a positive response variable, the variance may be non-constant, as its variance may have relationship with the mean. In the present study, the responses DBP, SBP and HR are all positive and non-constant variances. These points have motivated us to identify the determinants of AMI risk factors in the WHAS data set[17].
The present report aims to identify the statistical significant determinants of diastolic BP, systolic BP and the heart rate of AMI patients in the WHAS data set[17]. It examines the determinants which are associated with the responses DBP, SBP and HR. In addition, it identifies the effects of the determinants on the respective responses. This report has identified many determinants of DBP, SBP and HR of 500 patients with 21 factors/variables in the WHAS data set. Note that these three responses are positive, non-constant variances and non-replicated. Statistical joint generalized linear gamma and Log-normal models are the suitable tools for analyzing this WHAS data set[15,16,18,20]. These two models are shortly described in the following section.
Methods
The present responses DBP, SBP and HR are all positive with non-constant variances. The positive data set is generally analyzed by using gamma or log-normal generalized linear models[16,18]. These two joint generalized linear models are clearly described in[15,16,20]. For ready reference, these two models are shortly reproduced herein. For the positive data yi’s with variance σi2, if
E(yi) = μi and Var (Yi) = σi2 μi 2
The transformation Zi = log (Yi) is used to stabilize the variance Var (Zi) ≈ σi2. However, if a parsimonious model is essential, an improved transformation is used. Therefore, various model assumptions may be failed by a single data transformation. Nelder and Lee[21] proposed using joint Generalized Linear Models (GLMs) for the mean and dispersion.
For the positive response Yi, the log transformation Zi = log Yi is used. For the log-normal distribution, a joint modeling of the mean and dispersion is given by
E (Zi) = μ zi and Var (Zi) = σzi2,
μzi = xit β and log (σzi2) = git γ,
Where xit and git are the row vectors for the regression coefficients β and γ in the mean and dispersion model, respectively.
The Joint Generalized Linear Models (JGLMs) is used for analyzing positive data yi . If
E(yi) = μi and Var (yi) = σi2 V(μi),
Where V (μi) is the variance function and ’s the dispersion parameters. Note that in GLMs, the variance has two components. One is V(μi) which depends on the mean changes, and the σi 2 is independent of mean adjustment. It is well known that the variance function identifies the GLM family distribution. For example the GLM distribution is Poisson if V (μ) = μ, gamma if V(μ) = μ2 , normal if V(μ)= 1, etc. Therefore, the joint mean and the dispersion models are
ηi = g(μi) = xit β and εi = h(σi2) = wit γ,
Where g(·) and h(·) are GLM link functions (a function between the mean or the variance and the linear predictors) respectively, for the mean and the dispersion and xit, wit are the row vectors respectively, for the regression models of mean and dispersion. Note that the Maximum Likelihood (ML) Method And The Restricted ML (REML) are applied respectively, for estimating the mean and dispersion parameters[20,21]. For further study, readers may go through[22,23].
WHAS Data Description, Analysis, Results and Interpretations
WHAS data description: The Worcester heart attack study was conducted by Dr. Robert J. Goldberg, Department of Cardiology at the University of Massachusetts Medical School. The WHAS data set contains 21 variables/ factors on 500 subjects[17]. This data can be found at the following Wiley’s FTP site: ftp//ftp.wiley.com/public/sci tech med/survival.
This data set has been collected to identify the variables/factors which are correlated with trends over time in the survival & incidence rates, following hospital admission for AMI. This data set has been collected beginning in 1975 and extending through 2001 on all AMI patients admitted to hospitals in the Worcester, Massachusetts Standard Metropolitan Statistical Area. The factors/ variables of the WHAS are:
1. Age at hospital admission (AGE), 2. Gender (0 = male, 1 = female) (SEX), 3. Initial Heart Rate (HR), 4. Initial Systolic Blood Pressure (SBP), 5. Initial Diastolic BP (DBP), 6. Body Mass Index (BMI), 7. History of Cardiovascular Disease (0 = no, 1 = yes) (CVD), 8. Atrial Fibrillation (0 = no, 1 = yes) (AFB), 9. Cardiogenic Shock (0 = no, 1 = yes) (SHO), 10. Congestive Heart Complications (0 = no, 1 = yes) (CHF), 11. Complete Heart Block (0 = no, 1= yes) (AV3), 12. MI Order (0 = first, 1 = recurrent) (MIORD), 13. MI type (0 = non Q-wave, 1 = Q-wave, where the Q wave represents the normal left-to-right depolarisation of the interventricular septum) (MITYPE), 14. Cohort Year (1 = 1997, 2 = 1999, 3 = 2001) (YEAR), 15. Hospital Admission Date (ADMITDATE), 16. Hospital Discharge Date (DISDATE), 17. Date of last follow up (FDATE), 18. Length of hospital Stay days from hospital admission to hospital discharge (LOS), 19. Discharge Status from Hospital (0 = alive, 1 = dead) (DSTAT), 20. Total Length of Follow-Up Days from Hospital Admission Date to Date of Last Follow-Up (LENFOL), 21. Vital status at last follow-up (0 = alive, 1 = dead) (FSTAT).
Variables
Dependent variables: This report aims to locate the determinants of SBP, DBP and HR of the WHAS data set. Here we have considered three separate analyses. In the first analysis, we have considered the DBP as the dependent variable, and the remaining others are considered as the explanatory variables. The second analysis considers the SBP as the dependent variable, and the remaining others as the independent variables. The third analysis considers the HR as the dependent variable, and the remaining others are treated as the explanatory variables.
Independent variables: The WHAS data set contains two sets of independent variables, namely, qualitative and quantitative. Only six are continuous variables and the remaining fifteen are categorical variables. Levels of the categorical variables are described as in above.
The Diastolic Blood Pressure (DBP) analysis, results and interpretations: The continuous response DBP has been modeled based on the remaining other factors/ variables using both the gamma and the Log-normal models. The selected models have the smallest Akaike Information Criterion (AIC) value in each class. Note that the AIC selects a model which minimizes the predicted additive errors and squared error loss[24]. It is observed that the gamma model fit (AIC = 4173.974) gives better results than the Log-normal fit (AIC = 4257.000). The summarized joint gamma model fit results are displayed in (Table 1).
Table 1: Mean & variance models of Gamma fit results of Diastolic Blood Pressure (DBP).
| Model | Covariate | Estimate | Standard error | t-value | P-value |
|---|---|---|---|---|---|
| Mean Model | Constant | 3.5001 | 0.09484 | 36.906 | < 0.001 |
| AGE | -0.0030 | 0.00072 | -4.157 | < 0.001 | |
| SEX | -0.0244 | 0.01829 | -1.333 | 0.183 | |
| Heart Rate (HR) | 0.0019 | 0.00037 | 5.302 | < 0.001 | |
| Systolic BP (SBP) | 0.0057 | 0.00029 | 19.639 | < 0.001 | |
| Body Mass Index (BMI) | 0.0024 | 0.00193 | 1.236 | 0.217 | |
| Atrial Fibrillation (AFB) | 0.0377 | 0.02093 | 1.803 | 0.072 | |
| Cardiogenic Shock (SHO) | 0.0712 | 0.03384 | 2.104 | 0.036 | |
| Congestive Heart Complications (CHF) | -0.0541 | 0.01996 | -2.712 | 0.007 | |
| MI Order (MIORD) | -0.0415 | 0.02152 | -1.930 | 0.054 | |
| MI Type (MITYPE) | 0.1059 | 0.01971 | 5.372 | < 0.001 | |
| Dispersion Model | Constant | -5.556 | 0.4063 | -13.676 | < 0.001 |
| Systolic BP (SBP) | 0.007 | 0.0020 | 3.323 | 0.001 | |
| Body mass index (BMI) | 0.042 | 0.0125 | 3.347 | 0.001 | |
| Atrial Fibrillation (AFB) | -0.496 | 0.1819 | -2.724 | 0.007 | |
| Complete heart block (AV3) | -1.334 | 0.4741 | -2.814 | 0.005 | |
| MI Order (MIORD) | 0.460 | 0.1393 | 3.300 | 0.001 | |
| Cohort year (YEAR)2 | 0.480 | 0.1673 | 2.870 | 0.004 | |
| Cohort year (YEAR)3 | 0.453 | 0.1815 | 2.497 | 0.013 |
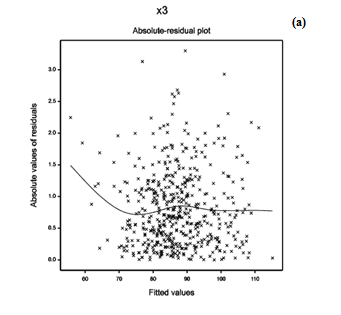
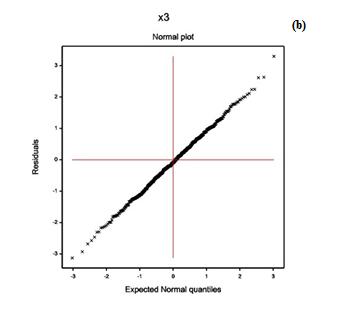
To examine the appropriate model fit (in Table 1), diagnostic plots are very important. As a diagnostic plot, the absolute residuals are plotted with respect to fitted values in Figure 1(a) which is completely a flat diagram with the running means, indicating that the variance is constant for the fitted model. Figure 1(b) reveals the normal probability plot of the gamma fitted mean model (Table 1), which does not show any lack of fit for variables or outliers, as there is not any gap in the figure.
Figure 1: For the gamma fitted models of diastolic blood pressure (Table 1), the (a) absolute residuals plot with respect to fitted values, and the (b) normal probability plot of the mean model.
From Table 1, the following results and the interpretations about DBP can be obtained.
(i) The mean DBP is inversely associated with the AGE (P < 0.001), indicating that the DBP increases as the age decreases. Note that the average age of the subjects is 69.85 years, and the minimum age is 30 years, while the maximum age is 104 years. Therefore, the DBP is high for the younger AMI patients in the WHAS data set.
(ii) The mean DBP is positively associated with the Heart Rate (HR) (P < 0.001), indicating that the DBP increases as the HR increases.
(iii) The mean DBP is positively associated with the Systolic Blood Pressure (SBP) (P < 0.001), indicating that the DBP increases as the SBP increases, which is observed in practice.
(iv) The mean DBP is positively associated with the atrial fibrillation (0 = no, 1 = yes) (AFB) (P = 0.072), indicating that theAMI patients with AFB have higher DBP.
(v) The mean DBP is positively associated with the cardiogenic shock (0 = no, 1 = yes) (SHO) (P = 0.036), indicating that the AMI patients with SHO have higher DBP.
(vi) The mean DBP is negatively associated with the congestive heart complications (0 = no, 1 = yes) (CHF) (P = 0.007), indicating that the AMI patients without CHF have higher DBP.
(vii) The mean DBP is negatively associated with the myocardial infarction (MI) order (0 = first, 1 = recurrent) (MIORD) (P = 0.054), indicating that the AMI patients at first MIORD have higher DBP.
(viii) The mean DBP is positively associated with the MI type (0 = non Q-wave, 1 = Q-wave) (MITYPE) (P < 0.001), indicating that the AMI patients with Q-wave MITYPE have higher DBP.
(ix) Variance of DBP is positively associated with the SBP (P = 0.001), indicating that the DBP variance is high for the AMI patients having high SBP.
(x) DBP variance is positively associated with the body mass index (BMI) (P = 0.001), indicating that the DBP variance is high for the AMI patients having high BMI.
(xi) DBP variance is negatively associated with the AFB (P = 0.007), indicating that the DBP variance is high for the AMI patients with no AFB.
(xii) DBP variance is negatively associated with the complete heart block (0 = no, 1 = yes) (AV3) (P = 0.005), indicating that the DBP variance is high for the AMI patients with no AV3.
(xiii) DBP variance is positively associated with the MIORD (P = 0.001), indicating that the DBP variance is high for the AMI patients with recurrent MIORD.
(xiv) DBP variance is positively associated with the cohort year (1 = 1997, 2 = 1999, 3 = 2001) (YEAR) at (2 = 1999) (P = 0.004) and, at (3 = 2001) (P = 0.013), indicating that the DBP variance is higher for the AMI patients at YEAR 2 or 3, than 1.
The Systolic Blood Pressure (SBP) analysis, results and interpretations: The continuous response SBP has been modeled based on the remaining other factors/ variables using both the gamma and the Log-normal models. The selected models have the smallest AIC value in each class. In this case, the Log-normal model fit (AIC = 4559.000) gives better results than the gamma fit (AIC = 4572.512). The summarized joint Log-normal model fit results are displayed in (Table 2).
Table 2: Mean & variance models of Log-normal fit results of Systolic Blood Pressure (SBP).
| Model | Covariate | Estimate | Standard error | t-value | P-value |
|---|---|---|---|---|---|
| Mean Model | Constant | 4.3285 | 0.07441 | 58.17 | < 0.001 |
| AGE | 0.0015 | 0.00059 | 2.49 | 0.013 | |
| SEX | 0.0474 | 0.01567 | 3.03 | 0.002 | |
| Heart rate (HR) | -0.0012 | 0.00032 | -3.68 | < 0.001 | |
| Diastolic BP (DBP) | 0.0071 | 0.00036 | 19.88 | < 0.001 | |
| Body mass index (BMI) | 0.0019 | 0.00150 | 1.26 | 0.208 | |
| History of Cardiovascular Disease (CVD) | 0.0409 | 0.01611 | 2.54 | 0.011 | |
| Atrial Fibrillation (AFB) | -0.0529 | 0.02069 | -2.56 | 0.011 | |
| Cardiogenic Shock (SHO) | -0.1761 | 0.04565 | -3.86 | < 0.001 | |
| MI Type (MITYPE) | -0.0612 | 0.01676 | -3.65 | < 0.001 | |
| Dispersion Model | Constant | -4.166 | 0.1608 | -25.907 | < 0.001 |
| History of Cardiovascular Disease (CVD) | 0.482 | 0.1514 | 3.182 | 0.002 | |
| Cardiogenic Shock (SHO) | 0.468 | 0.3328 | 1.407 | 0.160 | |
| MI Order (MIORD) | -0.205 | 0.1394 | -1.470 | 0.142 | |
| Cohort year (YEAR)2 | 0.257 | 0.1584 | 1.619 | 0.106 | |
| Cohort year (YEAR)3 | 0.526 | 0.1675 | 3.139 | 0.160 |
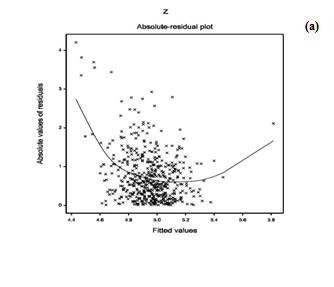
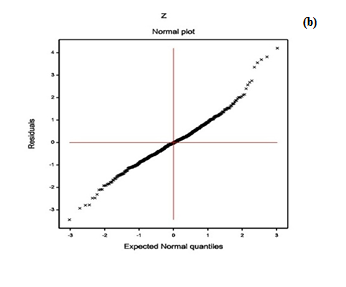
For the fitted Log-normal models (Table 2) of SBP, the model fitting diagnostic plots-residual and normal probability plots are displayed in Figure 2. Figure 2(a) presents the absolute residuals plot (Table 2) with respect to fitted values. It is almost flat, except the left tail, as the largest residual is located at the left boundary. Thus, the left tail of Figure 2(a) is decreasing. Figure 2(b) gives the normal probability plot of the Log-normal fitted mean model (Table 2). It does not show any lack of fit, as there is not any gap in the figure.
Figure 2: For the fitted Log-normal models of systolic blood pressure (Table 2), the (a) absolute residuals plot with respect to fitted values, and the (b) normal probability plot of the mean model.
From (Table 2), the following results and the interpretations about SBP can be obtained.
(i) The mean SBP is directly associated with the AGE (P = 0.013), indicating that the SBP increases at older ages. Note that the average age of the subjects is 69.85 years with minimum age is 30 years.
(ii) The mean SBP is directly associated with the SEX (0 = male, 1 = female) (P = 0.002), indicating that that the SBP is higher for female than the male AMI patients.
(iii) The mean SBP is negatively associated with the HR (P < 0.001), indicating that the SBP increases as the HR decreases.
(iv) The mean SBP is directly associated with the DBP (P < 0.001), indicating that the SBP increases as the DBP increases, which is observed in practice.
(v) The mean SBP is directly associated with the history of cardiovascular disease (0 = no, 1 = yes) (CVD) (P = 0.011), indicating that the SBP is higher of AMI patients with CVD.
(vi) The mean SBP is negatively associated with the atrial fibrillation (0 = no, 1 = yes) (AFB) (P = 0.011), indicating that the SBP is higher of AMI patients without AFB.
(vii) The mean SBP is negatively associated with the cardiogenic shock (SHO) (0 = no, 1 = yes) (SHO) (P < 0.001), indicating that the SBP is higher of AMI patients without SHO.
(viii) The mean SBP is negatively associated with the MI type (MITYPE) (0 = non Q-wave, 1= Q-wave) (MITYPE) (P < 0.001), indicating that the SBP is higher of AMI patients with non Q-wave MITYPE.
(ix) The variance of SBP is directly associated with the CVD (P = 0.002), indicating that the SBP variance is higher of AMI patients with CVD.
(x) The SBP variance is directly associated with the cohort year (1 = 1997, 2 = 1999, 3 = 2001) (YEAR) at the year 3 = 2001, (P = 0.002), indicating that the SBP variance is higher of AMI patients at the year 3 = 2001, than the other years.
The Heart Rate (HR) analysis, results and interpretations: The continuous response heart rate (HR) has been modeled based on the remaining other factors/ variables using both the gamma and the Log-normal models. The selected models have the smallest AIC value in each class. For HR, the gamma model fit (AIC = 4442.884) gives better results than the Log-normal fit (AIC = 4448.000). The summarized joint gamma model fit results are displayed in (Table 3).
Table 3: Mean & variance models of Gamma fit results of Heart Rate (HR).
| Model | Covariate | Estimate | Standard error | t-value | P-value |
|---|---|---|---|---|---|
| Mean Model | Constant | 4.3623 | 0.08375 | 52.089 | < 0.001 |
| AGE | 0.0017 | 0.00084 | 2.072 | 0.039 | |
| SEX | 0.0339 | 0.02333 | 1.454 | 0.147 | |
| Systolic BP (SBP) | -0.0015 | 0.00043 | -3.511 | < 0.001 | |
| Diastolic BP (DBP) | 0.0030 | 0.00066 | 4.483 | < 0.001 | |
| History of Cardiovascular Disease (CVD) | -0.0448 | 0.02683 | -1.671 | 0.095 | |
| Congestive Heart Complications (CHF) | 0.1444 | 0.02484 | 5.813 | < 0.001 | |
| Complete heart block (AV3) | -0.2742 | 0.12836 | -2.136 | 0.033 | |
| MI TYPE | -0.1045 | 0.02596 | -4.026 | < 0.001 | |
| Cohort year (YEAR)2 | -0.0565 | 0.02630 | -2.148 | 0.032 | |
| Cohort year (YEAR)3 | 0.0041 | 0.02788 | 0.149 | 0.882 | |
| Dispersion Model | Constant | -2.3066 | 0.3025 | -7.625 | < 0.001 |
| SEX | -0.2531 | 0.1345 | -1.881 | 0.061 | |
| Systolic BP (SBP) | -0.0034 | 0.0020 | -1.670 | 0.095 | |
| Atrial Fibrillation (AFB) | 0.2825 | 0.1766 | 1.600 | 0.110 | |
| Cardiogenic Shock (SHO) | 0.4550 | 0.3298 | 1.380 | 0.168 | |
| Complete heart block (AV3) | 0.9932 | 0.4552 | 2.182 | 0.029 |
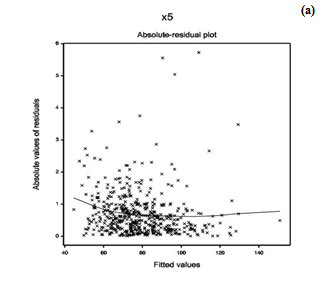
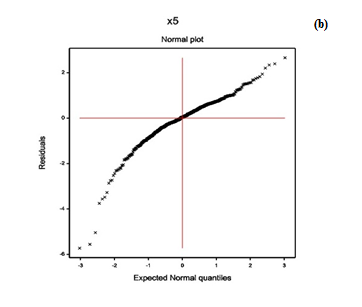
For the gamma fitted HR models (Table 3), the model fitting diagnostic plots-residual and normal probability plots are displayed in Figure 3. Figure 3(a) presents the absolute residuals plot (Table 3) with respect to fitted values, which is completely a flat diagram with the running means, indicating that the variance is constant for the fitted model. Figure 3(b) reveals the normal probability plot of the gamma fitted mean model (Table 3). It shows no lack of fit, as there is not any gap in the figure.
Figure 3: For the fitted gamma models of heart rate (Table 3), the (a) absolute residuals plot with respect to fitted values, and the (b) normal probability plot of the mean model.
From (Table 3), the following results and the interpretations about HR can be obtained.
(i) The mean HR is positively associated with the AGE (P = 0.039), indicating that the HR increases at higher ages. Note that the average age of the subjects is 69.85 years with minimum age is 30 years.
(ii) The mean HR is negatively associated with the SBP (P < 0.001), indicating that the HR increases as the SBP decreases.
(iii) The mean HR is directly associated with the DBP (P < 0.001), indicating that the HR increases as the DBP increases.
(iv) The mean HR is inversely partially associated with the history of cardiovascular disease (0 = no, 1 = yes) (CVD) (P = 0.095), indicating that the HR is higher of AMI patients without CVD. Note that in epidemiology, partially significant factors are known as confounder.
(v) The mean HR is positively associated with the Congestive Heart Complications (0 = no, 1 = yes) (CHF) (P < 0.001), indicating that the HR is higher of AMI patients with CHF.
(vi) The mean HR is negatively associated with the complete heart block (0 = no, 1= yes) (AV3) (P = 0.033), indicating that the HR is higher of AMI patients with no AV3.
(vii) The mean HR is negatively associated with the MI type (MITYPE) (0 = non Q-wave, 1 = Q-wave) (MITYPE) (P < 0.001), indicating that the HR is higher of AMI patients with non Q-wave MITYPE.
(viii) The mean HR is negatively associated with the cohort year (1 = 1997, 2 = 1999, 3 = 2001) (YEAR) at the year 2 = 1999 (P = 0.032), indicating that the HR is higher of AMI patients at the year 2 =1999, than the other years.
(ix) The variance of HR is inversely associated with the SEX (0 = male, 1 = female) (P = 0.061), indicating that the HR variance is higher of male AMI patients than female.
(x) The variance of HR is inversely associated with the SBP (P = 0.095) (partially), indicating that the HR variance increases as the SBP decreases. Note that the mean and the variance of HR satisfy the same association with the SBP.
(xi) The HR variance is positively associated with the complete heart block (0 = no, 1 = yes) (AV3) (P = 0.029), indicating that the HR variance is higher of AMI patients with AV3.
Concluding Remarks and Discussion
The present report examines the cardiac parameters--diastolic BP, systolic BP, and the heart rate of WHAS data set. The determinants of SBP, DBP and HR are derived based on the gamma and the Log-normal models. To examine the model fitting, relevant diagnostic plots are also displayed in the report. Based on approximately true model fittings, many conclusions are derived in the report. One can verify the present results examining the data set given in Wiley’s FTP site: ftp//ftp.wiley. com/public/sci_tech_med/survival.
A study of WHAS data set has been given in[22], which is only related to the factors associated to survival time and incidence rate of AMI patients. Based on our knowledge, there is no study of cardiac parameters-SBP, DBP and HR of the AMI patients in the WHAS. It is expected that all the derived results in this report are completely new in MI literature. The present results cannot compared with the earlier results as there is no similar study in the WHAS.
The present report shows many consistent results. For example, SBP and DBP are directly associated (Table 1 & Table 2), which is really observed in practice for heart patients. DBP and HR are directly associated (Table 1 & Table 3), while SBP and HR are inversely correlated (Table 2 & Table 3). Note that DBP is separately positively associated with HR, AFB, SHO and MITYPE, while SBP is separately negatively correlated with each of them. Age is negatively associated with DBP, but it is positively associated with SBP. Sex is positively associated with SBP, while it is negatively partially significant (P = 0.183) with DBP. Some reverse association is observed between SBP and DBP. Clinical explanations on these derived results are not explained in the report, as the author is not an expert in this area. The reported results in the present article, though not completely conclusive, are revealing.
The derived results in the report satisfy five statistical data analysis criteria. First, the result reported here is based on comparison of both the gamma and the Log-normal models. Second, the appropriate model is reported here based on the smallest AIC value. Third, estimates of the parameters have small standard deviation (Tables 1, 2 & 3), indicating that the estimates are stable. Fourth, models are selected based on graphical diagnostic tools. Fifth, final model is selected based on appropriate distribution of the response variable. Thus, the research should have greater faith in the present reported results.
The results and their interpretations are clearly described above. These results are related with the AMI patients in the WHAS data set. This report recommends the following for all individuals. The most important recommendation for the medical practitioners is to take care on the identified risk factors for the AMI patients. Note that the blood pressures SBP, DBP and the heart rate are highly associated to each other. Everyone should care on the blood pressures and heart rate. On older age, care should be taken on blood pressure, heart rate, cardiogenic shock, and other cardiac problems.
Acknowledge:
The author is very much indebted to the referees who have provided valuable comments to improve this paper. The author thanks Dr. Robert J. Goldberg of the Department of Cardiology at the University of Massachusetts Medical School, who generously provided the data sets to freely distribute and use for non-commercial purposes.
Conflict of interest:
The author confirms that this article content has no conflict of interest.
References
- 1. Kearney, P.M., Whelton, M., Reynolds, K., et al. Global burden of hypertension: analysis of worldwide data. (2005) Lancet 365(9455): 217-223.
- 2. Micha, R., Wallace, S.K., Mozaffarian, D. Red and processed meat consumption and risk of incident coronary heart disease, stroke, and diabetes mellitus: A systematic review and meta-analysis. (2010) Circulation 121(21): 2271-2283.
- 3. Menni, C. Blood pressure pharmacogenomics: gazing into a misty crystal ball. (2015) J Hypertens 33(6): 1142-1143.
- 4. Falaschetti, E., Chaudhury, M., Mindell, J., et al. Continued improvement in hypertension management in England: results from the Health Survey for England 2006. (2009) Hypertension 53(3): 480-486.
- 5. Parati, G., Ochoa, J.E., Lombardi, C., et al. Assessment and management of blood pressure variability. (2013) Nat Rev Cardiol 10(3): 143-155.
- 6. Stergiou, G.S., Bliziotis, I.A. Home blood pressure monitoring in the diagnosis and treatment of hypertension: a systematic review. (2011) Am J Hypertens 24(2): 123-134.
- 7. Das, R.N. Hypertension risk factors who underwent Dobutamine stress echocardiography. (2016) Interventional Cardiology 8(5): 683-693.
- 8. Das, R.N. Cardiac risk factors for patients under DSE. (2016) Gen Med 4(5): 270.
- 9. van der Sijde, J.N., Boiten, H.J., van Domburg, R.T., et al. Long-Term ( > 10 Years) Prognostic Value of Dobutamine Stress Echocardiography in a High-Risk Cohort. (2016) Am J Cardiol 117(7): 1078-1083.
- 10. Yao, S.S., Supariwala, A., Yao, A., et al. Prognostic value of stress echocardiography in patients with low-intermediate or high short-term (10 Years) versus low (< 39%) or high (≥ 39%) lifetime predicted risk of cardiovascular disease according to the American College of Cardiology/American Heart Association 2013 cardiovascular risk calculator. (2015) Am J Cardiol 116(5): 725-729.
- 11. Parati, G., Ochoa, J.E., Lombardi, C., et al. Assessment and management of blood pressure variability. (2013) Nat Rev Cardiol 10(3): 143-155.
- 12. Mena, L., Pintos, S., Queipo, N.V., et al. A reliable index for the prognostic significance of blood pressure variability. (2005) J Hypertens 23(3): 505-511.
- 13. Geleijnse, M.L., Fioretti, P.M., Roelandt, J.R. Methodology, feasibility, safety and diagnostic accuracy of dobutamine stress echocardiography. (1997) J Am Coll Cardiol 30(3): 595-606.
- 14. Parati, G., Rizzoni, D. Assessing the prognostic relevance of blood pressure variability: discrepant information from different indices. (2005) J Hypertens 23(3): 483-486.
- 15. Myers, R.H., Montgomery, D.C., Vining, G.G., et al. Generalized Linear Models with Applications in Engineering and the Sciences. (2010) John Wiley & Sons.
- 16. Lee, Y., Nelder, J.A., Pawitan, Y. Generalized Linear Models with Random Effects (Unified Analysis via H-likelihood). (2006) Chapman & Hall.
- 17. Hosmer, D.W., Lemeshow, S., May, S. Applied Survival Analysis: Regression Modeling of Time to Event Data: Second Edition. (2008) John Wiley and Sons Inc.
- 18. Firth, D. Multiplicative errors: log-normal or gamma? (1988) J R Statist Soc B 50(2): 266-268.
- 19. Das, R.N., Park, J.S. Discrepancy in regression estimates between log-normal and gamma: some case studies. (2012) J Applied Statistics 39(1): 97-111.
- 20. Das, R.N. Robust Response Surfaces, Regression, and Positive Data Analyses. (2014) Chapman & Hall.
- 21. Nelder, J.A., Lee, Y. Generalized linear models for the analysis of Taguchi-type experiments. (1991) Applied Stochastic Models in Business and Industry 7(1): 107-120.
- 22. McCullagh, P., Nelder, J.A. Generalized Linear Models. (1989) Chapman & Hall.
- 23. Das, R.N., Lee, Y. Log normal versus gamma models for analyzing data from quality improvement experiments. (2009) Qual Engineering 21(1): 79-87.
- 24. Hastie, T., Tibshirani, R., Friedman, J. The Elements of Statistical Learning. (2009) Springer.


