
Evaluation of Food Nitrogen and Its Protein Quality Assessment Methods
Radhika Jain*, Sangeeta Goomer
Affiliation
Lady Irwin College, University of Delhi, India
Corresponding Author
Radhika Jain, Research Scholar, Lady Irwin College, University of Delhi, India, E-mail: rjain09@yahoo.com
Citation
Jain, R., et al. Evaluation of Food Nitrogen and Its Protein Quality Assessment Methods. (2019) J Food Nutr Sci 6(1): 68-74.
Copy rights
© 2019 Jain, R. This is an Open access article distributed under the terms of Creative Commons Attribution 4.0 International License.
Keywords
Dumas; Kjeldahl; Nitrogen content; Protein quality
Abstract
Protein bioavailability is a major concern in today’s dietary palate.Food protein is mainly quantified in terms of its nitrogen content.Nitrogen can be present aspureorganic and/or inorganic form. It is highly dependent on the degree and sequences of amino acids. This in turn defines protein quality, which is an important factor especially for plant eating population. The present article aims to focus upon food nitrogen and its methods, commonly practised in laboratory. Also, the methods to assess protein quality will be extensively reviewed.
Introduction
Crude protein is an important dietary nutrient. Proteins are an assembly of amino acids which are fundamental to basic human physiology[1]. It supports metabolizing tissues and enzymes thatcontrol the chemistry of an organism. Nitrogenis an irreplaceable element of amino acid backbone which defines its quantity as well as quality of protein. Nitrogen homeostasis is a highly regulated function whichaids in the functioning of heme, hormones, immune mediators, antioxidants and neurotransmitters. The element adds to the synthesis of compounds such as purines and pyrimidine which stores and processes all genetic information[1-3]. Hence, the rising need to increase nitrogen in agriculture is of major research concern.Developed economies utilizes such information to improve in agricultural output which will in-turn aid in overall health, export purposes as well as animal rearing for consumption whereas developing nation targets at malnutrition and everyday diet quality[1].
The estimation of nitrogen is highly dependent upon its amino acids.Over 300 amino acids are found in nature from animals, plants and microbes, but only 20 of them are essentially required to fulfil human protein requirements. Adults cannot synthesis 08amino acids while children require 01 additional to these 08 amino acids[1]. They are termed as essential amino acids, which are to be consumed in diet. Both essential and non-essential amino acids are vital and hold utmost importance to support metabolic activities. A review by Hou, et al 2015[4], summarises many researches focussing on amino acid nutrition and metabolism in humans and rats spanned over the century.Non/Semi essential amino acid such as cysteine, tryptophan and hydroxylysine regulates the synthesis of essential amino acids. The process of de novo synthesis of essential amino acid as well as non-essential amino acids is majorly dependent upon the presence of non-essential amino acid through diet[3].
In intestinal lumen, amino acid travels through extracellular spaces for catabolism as either free amino acid or dipeptides. Unlike fat, proteins cannot be stored and needs to be replaced in small amount on daily basis to maintain protein losses caused by breakdown and reutilization of the compounds, excretions of nitrogen in urine, faeces and sweat, shedding of skin and cutting of hair and nails. The removal depends upon various factors such as nitrogen intake, renal condition, hydration state and anabolic/catabolic state of the individual[1,2]. The need to support human metabolism through protein varies and hence, there requirement. About 0.8-1.0 g/kg body weight/day of well-balanced amino acid is said to achieve recommended standards (WHO, 2007).
Jones Factor
The knowledge of protein is generally skewed among researchers. Excess consumption of protein is unhealthy as well as uneconomical. Unlike carbohydrates and fats estimation, the method to quantify protein content does not involve separation and weighing of the pure protein. Earlier, when few protein sources from animal origin were known, such as serum albumin, serum globulin and milk casein, an average value of 16% of nitrogen was found. The percentage of protein was calculated on the basis of its nitrogen content. Therefore, a value of 6.25 (100 ÷ 16) in 1 kg of plant or animal source was achieved[5,6]. For this calculation, two major assumptions have been made, (1) Nitrogen in food material is the only protein nitrogen and (2) all protein sourcescontain 16% of nitrogen content. For many years, food protein was not systematically studied for its total nitrogenous constituents. Proteins differ in terms of chemical makeup and further its food value. One of the major obstacles was the lack of information on non-protein nitrogen. This problem still exists and requires in depth research. To resolve second assumption, data has been analysed which when usedwill represent more nearly to the true protein content[5,6].
In 1931,Jones’s[6] worked on the nitrogen factor for many plant protein sources. The chemical composition and nature of protein of many food ingredients was utilised to estimate the protein conversion factor. Jones had extensively stated the relationship between the nitrogen and amino acid in grains (Table 1).
Table 1: Relationship between nitrogen and amino acid content
|
Source of Protein |
Source of Protein |
Nitrogen (%) |
Source of Protein |
Source of Protein |
Nitrogen (%) |
|
Almond |
Amandin |
19.3 |
Mung Bean |
á- Globulin â-Globulin |
15.7 16.7 |
|
Alfalfa leaves |
Protein |
15.8 |
Oat |
Prolamins Glutelin Globulin |
16.4 17.5 17.9 |
|
Avocado |
Salt soluble protein |
15.3 |
Pea |
Legumin Legumelin Vielin |
18 16.3 17.4 |
|
Barely |
Hordein Globulin Alpha-Glutelin Albumin |
17.2 18.1 16.2 16.6 |
Peanut |
Arachin Conarachinia |
18.3 18.2 |
|
Buckwheat |
Globulin |
17.4 |
Potato |
Tuberin |
16.4 |
|
Corn |
Zein Glutelin Globulin |
16.1 18 14.4 |
Rapseed |
Globulin |
17 |
|
Cowpea |
Vignin Legumelin |
17.2 16.4 |
Rice |
Globulin, coagulable at 74oC Globulin, coagulable at 90oC Oryzenin Prolamin |
16.3 17.9 16.8 16.2 |
|
Durum wheat |
Prolamin |
17.5 |
Rye |
Gliadin Glutelin Albumin |
17.7 16.7 16.7 |
|
Egg |
Ovalbumin Conalbumin Vitellin Livetin |
15.5 16.1 16.3 15.1 |
Seasame Seeds |
Alpha-Globulin Beta Globulin |
18.4 17.6 |
|
Lentil |
Legumin Vicilin Legumelin |
18.1 17.4 16.3 |
Soybean |
Glycinin Legumelin |
17.5 16.1 |
|
Lima Bean |
á - Globulin â -Globulin Albumin |
15.5 14.8 14.2 |
Sorghum |
Prolamin |
14.3 |
|
Milk (cow’s) |
Casein Lactalbumin Alcohol-soluble preoten |
15.9 15.4 15.7 |
Wheat endosperm |
Gliadin Glutenin á- glutelin â-glutelin |
17.6 17.5 17.1 16.1 |
Source: Adapted from Jones 1931
Table 1 clearly shows that various proteins were isolated from both plant and animal based products and the amount of nitrogen content analysed. Jones (1931) prepared and analysed the data for many sources himself. The rest he compiled from other investigators work. According to Table 1, the nitrogen content is varying from 19.30% (in almonds) to 14.30% (in sorghum). Hence, a common conversion factor of 6.25 shall not justify the true protein content of all food materials. The correct usage of nitrogen factor will allow the investigator to achieve maximum true protein content. Accumulation of extra storage proteins have shown to raise amino acid levels in mature food grains as well as an increase in nitrogen levels. Amino acids deposited on polypeptide chains of storage protein are interdependent. This concluded that the nitrogen levels are dependent on amino acids levels and vice versa[7].
Methods to Estimate Nitrogen Content
Quantification of nitrogen content is very important for determining dietary protein. Over time, various methods have been developed and arebeing practised. In biochemical investigations, experimental sampling involves extraction, isolation and sometimes purification to determine protein content. Protein is determined using methods such as biuret, bicinchoninic acid (BCA), ultraviolet (UV) absorption (at 280 nm), dye binding, Bradford, Lowry, ninhydrin and turbidimetry. These methods are based on properties of specific amino acid residues such as tyrosine, tryptophan, cysteine etcand/or peptide bonds. On the other hand, methods to determine food protein is a complex concept as proteins are present intricately with other components such as carbohydrates and fat. The above statedmethods do not show valid results for food protein. But, dye binding method has shown valid results for direct determination of milk protein[8,9].
In common practise, estimation of food protein is quantified using Kjeldahl and Dumas (combustion) method. Table 2 shows a brief overview of both the methods. Kjeldahl’s principle is based on wet chemistry which involves three steps: digestion, distillation and titration. During digestion, the food sample containing nitrogen isotope ratio (16N/14N) is converted into ammonium ion (NH4<+) from the reaction of nitrogen and sulphuric acid. It is assumed that nitrogen collected is majorly amino-nitrogen (total organic). The carbon and hydrogen elements present are converted into carbon di oxide and water. The contribution of inorganic nitrogen (nitrate, nitrite, and ammonium) or other organic nitrogen (nucleotides, nucleic acids) is negligible[9]. A study was conducted by Fujihara et al 2001[10], on total nitrogen content of vegetables using Kjeldahl method with salicylic acid as the catalyst. Vegetables contain significant amounts of nitrate levels which remained undetected because of Kjeldahl’s limitation of distinguishing protein-nitrogen and non-protein nitrogen.Similarly, other nitrogenous compound, such as nitrate-nitrogen and nucleic acid nitrogen affects the nitrogen: protein conversion factor for vegetables. Alkali is added to digested sample to neutralize the acid and further titrated against a standardised acid to obtain protein. It is tedious and time consuming procedure which requires careful disposal of hazardous wastes.
Table 2: Brief description of Kjeldahl and Dumas method
|
S.No |
Method |
Chemical Basis |
Method |
Advantages |
Disadvantages |
Application |
|
1 |
Kjeldahl (wet chemistry) |
Nitrogen (total organic) |
Digestion, neutralisation, distillation and titration |
Most common method used. Less complicated. Inexpensive |
Cannot distinguish between protein and non-protein nitrogen, the levels may be overestimated. Tedious disposal of hazardous waste. Time consuming method |
Applicable to all foods. Little used now, due to availability of automated Dumas systems |
|
2 |
Dumas/ Combustion (dry chemistry) |
Nitrogen (total organic and inorganic) |
Converting all forms of nitrogen into gaseous nitrogen oxides by combustion in induction furnace |
More accurate Reduce sample analysis time per 6mins. Safe Environmental Disposal as it requires no hazardous chemicals |
Difficult to use for low nitrogen and high fat content products. Expensive apparatus |
Applicable to all foods. Widely used now, compared to Kjeldahl method, for both official and quality control purposes |
Compiled from various Sources[6,8,9,11]
Many analytical laboratories use Dumas (combustion) method to determine protein content (Figure 1). This method was introduced in 1831 by Jean-Baptiste Dumas.As shown in Figure 1, the sample is combusted in the flow of pure oxygen at high temperature of 700–1,000°C. During flash combustion, the carbon in food ingredient is converted into carbon-di-oxide. Whereas, the nitrogen is converted to different nitrogenous components such as di-nitrogen (N2) and nitrogen oxides. In copper reduction column, nitrogen oxide is converted to nitrogen at a high temperature of 600°C. The nitrogen released is carried by pure helium and using the thermal conductivity detector, the nitrogen is quantified in gas chromatography. The estimated nitrogen content is converted into protein content using a correct protein conversion factor[8,9].

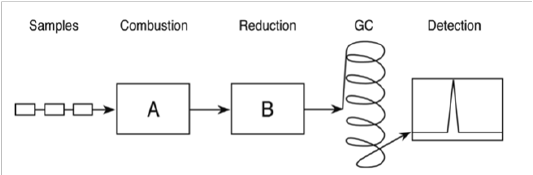
Figure 1: Simplified model of Dumas combustion method. (A) Combustion unit (B) Copper reduction unit, (GC) gas chromatography column, and detector[8].
The method is automated and therefore, becomes easy to use for routine unattended nitrogen determination. Dumas method is faster, safer, more accurate and with repeatable results in comparison to Kjeldahl method. It is valid for all types of foods samples[8]. One major drawback is the small sample size (20-300 mg) which may result in incorrect determination of nitrogen content. Careful sampling and milling techniques for sample preparations is necessary to reduce sample inhomogeneity and further, incorrect results. Samples with low nitrogen and high fat content are unsuitable for this technique[11]. Because of its nature, Dumas nitrogen is a true measure of total nitrogen[9]. Many authors have compared the accuracy of Kjeldahl and Dumas method for crude protein determination in agricultural products. Observation and conclusion of different experimentation were highly variable. Despite many varied observations, both the methods have gained official status by the American Association of Official Analytical Chemists (AOAC, 1984a, b)(Schmitter et al, 1989)[11].
Protein Quality
Foodprotein quantity is as important as its strength to provide quality. The necessity to meet protein requirements is based on theknowledge of the strength of food source as well as the population’s requirement[12](Fuller, 2012). Nowadays, there is an increasing demand of plant protein because of enhanced health benefits and environmental safety[13] (Hughes et al, 2011). Population based on plant food majorly faces inadequate protein quality. The amino acid sequence of plant protein requires to be balanced in defined ratio between/among each other to provide all essential amino acids through diet. Researches on in-depth knowledge of protein percentages have shown that certain combination of plant food, known as mutual supplementation, can meet amino acid requirements of humans.Animal proteins are knownto provide essential amino acids in required amounts for growth and maintenance. Egg and milk protein are efficiently utilized by the body and are used as references against which other proteins can be compared[3](Harper, 2015). Since many decades, researcher’s interest has been diverted towards plant sources. A review by Kies, 1974[14] highlights the discovery of opaque-2 corn having high lysine content. This was done to improve the cereal and plant protein quality by increasing the levels of first limiting amino acids.
Methods to determine Protein Quality
The structure and composition of proteins have a major influence in the human physiology. FAO/WHO,1990 stated that protein quality is determined by assessing the essential amino acids composition, digestibility and bioavailability(Hoffman et al, 2004)[14]. Over decades, various chemical and biological assays are used to quantify protein quality, but they are still too complicated, time consuming and expensive. Secondary assay methods such as protein efficiency ratio (PER), net protein ratio (NPR), net protein utilization (NPU), slope ratio assays, assay utilizing micro-organisms, proteolytic enzymes and amino acid profile, C-PER and T-PER are commonly practised(Satterlee et al, 1979)[16].
Protein Efficiency ratio (PER) is the most accepted method which was standardised to provide casein control diet or test diet to weanling rats. Both diets contain 10% protein each and were provided for 4weeks. This technique required measuring weight gain in grams per grams of protein consumed[17] (Schaafsma, G., 2005). The measured weight gain is compared to the standard value of casein.In humans the protein requirements are mainly dominated by maintenance requirements and not by growth. This method fails to measure the requirements for maintenance requirements. Also, there is an 50% growth requirement difference for sulphur containing amino acids between human and rats as rats requires more to develop fur[15,17].
Net protein ratio (NPR) was proposed to overcome limitation offered by PER assay. NPR was designed by Bender and Doell (1975) which included second group of animals on a protein free diet, requires 10-14 days to perform. They assumed that protein required preventing weight loss for animals on protein free diet is the amount/measure required as maintenance requirements for animals[15] (Hoffman et al, 2004). Net Protein Utilisation (NPU) utilizes body nitrogen instead of body weight. This involves NPU equivalency to biological value and protein digestibility. It was recognised by many researchers such as Bodwell that using human bioassay to determine NPU was a good standard. Data collected from this method can be further compared to various rat assays. He concluded that when data from human (primary assay) and rat (secondary assay) on same proteins were compared, the results did not show a close relationship between protein qualities achieved from either of the two assays. More researches are required to supplement the lack of data incurred between the primary assay and secondary assay. Net protein utilisation is calculated from the amount of nitrogen ingested and measuring the retention of absorbed nitrogen.Biological Value (BV) is another method which is similar to net protein utilisation. BV is calculated by estimating the amount of nitrogen absorbed and helps to measure protein’s maximal potential quality. It fails to estimate nitrogen content to support requirement level[15] (Hoffman et al, 2004).
Slope ratio assay or the relative nutritive value (RNV) assay involves feeding test proteins to rats for approximate three weeks at three levels (each protein limiting) and a zero protein level. Lactalbumin is used as the control protein. Using regression lines analysis, body weight to protein intake are determined and compared to control protein. Protein quality is reported in percentage of the control lactalbumin. Many assays use micro-organisms and proteolytic enzymes to assess the protein quality. Chemical score method is calculated using first limiting amino acid is compared to essential amino acid profile of whole egg. Oser has extensively researched on proteins and amino acids. His work suggests that protein quality should be estimated using all essential amino acids rather than only limiting amino acids. On the other hand, McLaughlan et al, 2015 recommends to use lysine, methionine and cysteine to estimate chemical score.The Joint FAO Expert Group on Protein Requirements proposed the use of a provisional reference pattern based on human amino acid requirements. This pattern was criticized by another expert committee as containing excessive tryptophan and the sulphur-containing amino acids. A revised standard reference pattern for essential amino acids was proposed by FAO/WHO. Although the chemical score is a valuable tool for screening of protein quality, it has one real fault: it assumes all amino acids are 100% available. Table 3 briefly summarised the method along with its merits and demerits. Table 3 briefly summarises these methods.
Table 3: Brief descriptions of various methods to determine protein quality*
|
S.No |
Method |
Description |
Merits |
Demerits |
|
1. |
Net Protein Ratio (NPR) |
Proposed to combat major flaw in PER. To do this, the NPR assay includes a second group of animals on a protein free diet and assumes the protein needed to prevent weight loss of the protein free group to be a measure of the maintenance requirement of the rat. |
10 to 14days to perform |
Protein maintenance requirement in rats |
|
2. |
Net protein utilisation |
The net protein utilization assay is similar to that of the NPR, but utilizes values of body nitrogen (N) instead of body weight. |
Focuses on biological value and protein digestibility |
Data collected from primary assay and secondary assay does not have a close relationship |
|
3. |
Protein Efficiency Ratio |
Uses single protein (10%) and measure the weight gain to protein consumed over 28day. |
Relates to growth requirements |
Does not make allowance for maintenance requirement. Yields non proportional data Biased against most plant protein. |
|
4. |
Slope Ratio Assay |
Test protein feed to rats at three levels (each protein limiting) plus a zero protein level. Require ca. three weeks |
Protein quality is expressed as percentage of control lactalbumin. |
|
|
5. |
Tetrahymena PER/ T-PER |
Utilizes Tetrahymena thermophila WH 14 on proteolytic hydrolyzed test product along with in-vitro protein digestibility |
Best for products such as meats, flours, protein concentrates and isolates or products whose exact composition is known. |
Difficult to control on day to day basis, the error is high compared to C-PER. Greatly affected by food additives and spices |
Protein Digestibility Corrected Amino Acid (PDCASS)
The concept of PDCASS is based on two principles i.e., 1) The ability to provide nutritional amino acid requirements of a protein or mixture is protein consumed is based on the content of first limiting essential amino acid and 2) only the absorbed amino acid can provide nutrition from protein diet , thus protein digestibility needs to be considered. The PDCASS principle assumes that essential amino acid bioavailability is shown by true faecal protein digestibility. Also, the composition of reference proteins is valid. Amino acid requirements and proteins are merely age dependent, therefore, the understanding of different essential amino acid are age dependent should be noted.Factors such as age, gut ability to respond to dietary nutrition will also affect (Sarwar, 1997) (Hoffman et al, 2004)[15]. Antinutritional factors are one of the major which hampers the amino acid absorption. Factors such as trypsin inhibitors, lectins, and tannins present in different food ingredients such as soybean meal and fava bean has been reported to increase endogenous protein losses at terminal ileum (Salgado et al., 2002).
A joint FAO/WHO/UNU Expert consultation on Energy and Protein Requirements (1981) was proposed to score amino acid patterns for infants, pre-school age children and adults. For infants, it was based on human breast milk composition and for pre-school aged children and adults it was on limited research data[17-23] (Schaafsma, G., 2005). FAO/WHO has widely accepted PDCASS as one of the reliable protein value scoring method in human nutrition. Schaafsma, 2000[18] reviewed PDCASS extensively and concluded that the protein quality can be assessed on the basis of its first limiting amino acids as percentage of the content of the same amino acid in a reference pattern of essential amino acids. Protein value exceeding 100% were automatically truncated to 100% as it was assumed that values more than 100% does not contribute additional benefits in humans. It is true only when human diet consist of protein, as occurs in infant feeding practices and enteral feeding. But, generally human consume mix diet which requires balance of the amino acid pattern for maximum protein quality (Satterlee et al, 1979)[16,24-27]. The reference are standardised on young individuals which overestimates the requirements for elderly population.
Protein Digestibility Corrected Amino Acid is measured in percentage as-
PDCASS%= (mg of first limiting amino acid in 1 g test protein)/(mg of the same amino acid in 1 g reference protein) * TD (%)
where, TD is true digestibility of faecal protein, as measured in rat assay. Studies have shown that amino acid that move through terminal ileum maybe consumed by bacteria and does not get utilized for protein synthesis, even though they do not appear in the faeces (Schaarfsma, 2000)[18]. However, to estimate true faecal digestibility, the location of protein synthesis is important and ileal digestibility would be more accurate. But, this is one of the demerits of PDCASS (Schaafsma 2000)[18,28-33].
Conclusion
Nitrogen is the fundamental element in determination of protein value. It forms the basis of amino acids whose sequences and arrangements acts in vital bodily functions. These amino acids are termed as essential and non-essential on the basis of their nutritional classification. Plant eating population majorly requires to focus on all essential amino acids for proper uptake and metabolism. Therefore, the need to quantify nitrogen and further protein is of much needed importance. A well balanced plant based meal is said to satisfy protein needs of an individuals. Our understanding for human needs have undergone many revisions and although certain uncertainties still remain, each country should research and draft its own requirements to address the issue more wisely.
References
- Smil, V. Nitrogen and food production: proteins for human diets. (2002) AMBIO: A Journal of the Human Environment 31(2): 126-131.
- Tessari, P. Nitrogen balance and protein requirements: Definition and measurements. (2006) In Cachexia and wasting: a modern approach Springer, Milano: 73-79.
Pubmed | Crossref | Others
- Rodwell, V., Bender, D., Botham, K.M., et al. Harpers illustrated biochemistry 30th edition. (2015) McGraw Hill Professional Google Scholar.
Pubmed | Crossref | Others
- Hou, Y., Yin, Y., Wu, G. Dietary essentiality of “nutritionally non-essential amino acids” for animals and humans. (2015) Exp Biol Med (Maywood) 240(8): 997-1007.
- Sriperm, N., Pesti, G.M., Tillman, P.B. Evaluation of the fixed nitrogen‐to‐protein (N: P) conversion factor (6.25) versus ingredient specific N: P conversion factors in feedstuffs. (2011) Journal of the Science of Food and Agriculture 91(7): 1182-1186.
- Jones, D.B., Factors for converting percentages of nitrogen in foods and feeds into percentages of protein. (1931) USDA Circ 183: 1-21.
Pubmed | Crossref | Others
- Huet, J.C., Baudet, J., Bettaieb, L., et al. Variation of the amino acid scores and of the nitrogen-to-protein conversion factors in barley grain as a function of nitrogen content as compared with wheat and rye. (1988) Plant Foods Hum Nutr 38(2): 175-188.
- Chang, S.K., Zhang, Y., Protein analysis. (2017) In Food analysis Springer, Cham 315-331.
Pubmed | Crossref | Others
- Simonne, A.H., Simonne, E.H., Eitenmiller, R.R.,et al. Could the Dumas method replace the Kjeldahl digestion for nitrogen and crude protein determinations in foods? (1997) Journal of the Science of Food and Agriculture 73(1): 39-45.
- Fujihara, S., Kasuga, A., Aoyagi, Y. Nitrogen‐to‐protein conversion factors for common vegetables in Japan. (2001) J Food Sci 66(3): 412-415.
- Schmitter, B.M., Rihs, T. Evaluation of a macrocombustion method for total nitrogen determination in feedstuffs. (1989) J Agricul Food Chem 37(4): 992-994.
- Fuller, M. Determination of protein and amino acid digestibility in foods including implications of gut microbial amino acid synthesis. (2012) Br J Nutr 108(S2): S238-S246.
- Hughes, G.J., Ryan, D.J., Mukherjea, R. Et al. Protein digestibility-corrected amino acid scores (PDCAAS) for soy protein isolates and concentrate: Criteria for evaluation. (2011) J Agric Food Chem 59(23): 12707-12712.
- Kies, C. Comparative value of various sources of nonspecific nitrogen for the human. (1974) J Agricul Food Chem 22(2): 190-193.
- Hoffman, J.R., Falvo, M.J. Protein–which is best? (2004) J Sports Sci Med 3(3): 118.
Pubmed | Crossref | Others
- Satterlee, L.D., Marshall, H.F., Tennyson, J.M. Measuring protein quality. (1979) J American Oil Chemists’ Society 56(3Part1): 103.
Pubmed | Crossref | Others
- Schaafsma, G. The protein digestibility-corrected amino acid score (PDCAAS)—a concept for describing protein quality in foods and food ingredients: a critical review. (2005) J AOAC Int 88(3): 988-994.
- Schaafsma, G., The protein digestibility–corrected amino acid score. (2000) J Nutr 130(7): 1865S-1867S.
- Beljkas, B., Matić, J., Milovanović, I., et al. Rapid method for determination of protein content in cereals and oilseeds: validation, measurement uncertainty and comparison with the Kjeldahl method. (2010) Accreditation and quality assurance 15(10): 555-561.
Pubmed | Crossref | Others
- Bradstreet, R.B., Modifications of Kjeldahl digestion for organic nitrogen. (1960) Analytical Chemistry 32(1): 114-117.
Pubmed | Crossref | Others
- Friedman, M., Nutritional value of proteins from different food sources. A review. (1996) J Agric Food Chem 44(1): 6-29.
Pubmed | Crossref | Others
- Gilani, G.S., Xiao, C.W., Cockell, K.A. Impact of antinutritional factors in food proteins on the digestibility of protein and the bioavailability of amino acids and on protein quality. (2012) Br J Nutr 108(S2): S315-S332.
- Grewal, A., Jood, S. Effect of processing treatments on nutritional and antinutritional contents of green gram. (2006) J Food Biochem 30(5): 535-546.
- Jackson, A.J., Capper, B.S., Matty, A.J. Evaluation of some plant proteins in complete diets for the tilapia Sarotherodonmossambicus. (1982) Aquaculture 27(2): 97-109.
Pubmed | Crossref | Others
- Khattab, R.Y., Arntfield, S.D. Nyachoti, C.M. Nutritional quality of legume seeds as affected by some physical treatments, Part 1: Protein quality evaluation. (2009) LWT-Food Science and Technology 42(6): 1107-1112.
Pubmed | Crossref | Others
- Layman, D.K., Anthony, T.G., Rasmussen, B.B., et al. Defining meal requirements for protein to optimize metabolic roles of amino acids. (2015) Am J Clin Nutr 101(6): 1330S-1338S.
- Mariotti, F., Tomé, D. Mirand, P.P. Converting nitrogen into protein—beyond 6.25 and Jones’ factors. (2008) Crit Rev Food Sci Nutr 48(2): 177-184.
- Minagawa, M., Winter, D.A. Kaplan, I.R. Comparison of Kjeldahl and combustion methods for measurement of nitrogen isotope ratios in organic matter. (1984) Analytical Chemistry 56(11): 1859-1861.
- Muñoz-Huerta, R., Guevara-Gonzalez, R., Contreras-Medina, L., et al. A review of methods for sensing the nitrogen status in plants: advantages, disadvantages and recent advances. (2013) Sensors 13(8): 10823-10843.
- Satyanarayan, U. Chakrapani, U. Proteins and amino acids. Essentials of Biochemistry-, Books and allied Pvt. Lmt. (2007) Publications, Kolkata 655-661.
Pubmed | Crossref | Others
- Srihara, P., Alexander, J.C. Protein quality of raw and autoclaved plant protein blends. (1983) Canadian Institute of Food Science and Technology Journal 16(1): 63-67.
Pubmed | Crossref | Others
- Wu, G. Dietary protein intake and human health. (2016) Food Funct 7(3): 1251-1265.
- Yeoh, H.H. Wee, Y.C. Leaf protein contents and nitrogen-to-protein conversion factors for 90 plant species. (1994) Food Chemistry 49(3): 245-250.


