Fractal Phenomena in Ferroelectrics
Affiliation
International Ctr. for Actuators & Transducers, The Pennsylvania State University University Park, PA 16802, USA
Corresponding Author
Uchino, K., et al. Fractal Phenomena in Ferroelectrics. (2014) J Nanotech Mater Sci 1(1): 12-26.
Citation
Uchino, K., et al. Fractal Phenomena in Ferroelectrics. (2014) J Nanotech Mater Sci 1(1): 1 – 15.
Copy rights
© 2014 Uchino, K. This is an Open access article distributed under the terms of Creative Commons Attribution 4.0 International License.
Keywords
Ferroelectric; Fractal; Fractal dimension; Critical exponent; Dielectric relaxation; Acoustic emission
Abstract
This paper discusses on ferroelectricity from fractal analysis viewpoints. Micro to macro ferroelectric domain growth changes the domain dynamics, leading to the changes in various physical properties such as dielectric permittivity, loss, polarization hysteresis, light scattering and acoustic emission.
Introduction
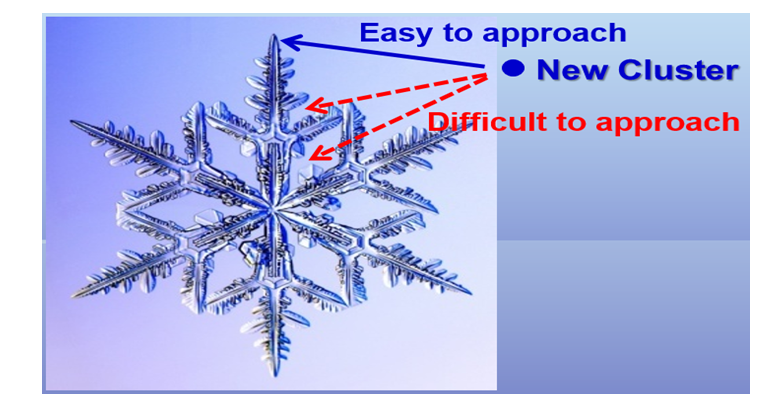
The concept of "fractal" means "self-similarity", that is, the contour/structure of a part of an object is similar to that of the whole object. In other words, the contour/structure seems to be similar, irrelevant to the observing scale. Though the fractal exhibits a rather complicated structure in general, it is expressed quantitatively in a simple way with using the "fractal dimension". Figure 1 shows various growth shapes of the snow crystal for different size ranges[1]. It is noteworthy that apparently-similar 6-fold crystal growth shapeswith a tree-branch pattern is observed irrelevant to the crystal size from μm to mm.The fractal dimension(defined later) of the snowflake is reported about 1.3, much less than the Euclidean dimenstion 2. This sort of geometrical, structural and dimensional specific may provide characteristic physical properties.
Figure 1: Growth shape differences of the snow crystal showing a tree-branch pattern[1]
We will discuss ferroelectricity from a fractal analysis viewpoint in this paper, based on our previously reported experimental papers:
1. Critical Exponents of the Dielectric Constantsin Diffused-Phase-Transition Crystals: Kenji Uchino and Shoichiro Nomura, Ferroelectrics Letters, Vol. 44, 55−61, 1982[2]
2. Dynamic Motion of the Domain Configuration in Relaxor Ferroelectric Single Crystals as a Function of Temperature and Electric Field:M. L. Mulvihill, L. E. Cross and K. Uchino, The 8th European Mtg. Ferroelectricity, P16-08, Nijmegen, July, 1995[3]
3. Acoustic Emission in Lead Zirconate Titanate PLZT(18/40/60) Ceramics with Small Electrostriction: H. Aburatani, J. P. Witham and K. Uchino, Jpn. J. Appl. Phys., 36, part 1, No.11, 6829-6831 (1997)[4]
4. A Study of Acoustic Emission in Piezoelectric Multilayer Ceramic Actuator:H. Aburatani and K. Uchino, Jpn. J. Appl. Phys., 37, part 1, No. 1, 204-209 (1998)[5]
5. Acoustic Emission in Damaged Ferroelectric Lead Zirconate Titanate Ceramics:H. Aburatani and K. Uchino, Jpn. J. Appl. Phys. 37, L553-L555, 1998[6]
6. A Fractal Analysis on Domain Related Electric Field Induced Acoustic Emission in Ferroelectric Ceramics: H. Aburatani, J. P. Witham and Kenji Uchino, Jpn. J. Appl. Phys. Vol. 37, pp. 602-605, 1998[7]
Micro to macro ferroelectric domain growth changes the domain dynamics, leading to the changes in various physical properties such as dielectric permittivity, loss, polarization hysteresis, and acoustic emission. Based on the above papers in wide-spread areas for a long period, we will discuss these changes from the fractal model.
II. Background of Fractal Analysis
There exist many fractal structures in the nature, and the formation mechanisms of the fractal structures are classified into three[8]
1. Irreversible and random growth process, exemplified by crystal growth, domain dynamics, destruction phenomenon, crack propagation
2. Convolutional effect in non-linear mechanical system, such as chaos
3. Critical phenomenon in an equilibrium condition, e.g., phase transition, with which this paper is most closely related.
A. Intuitive Origin of Fractal
Let us consider the origin of self-similarity of snowflake shapes shown in Fig. 1. Referring to Fig. 2, when a new cluster (i.e., water particle) approaches to an existing snowflake, it can be deposited easily at the tip of the branch, but may be difficult to reach into the joint part. This intuitive model can explain that the snow crystal grows with keeping the original 6-fold shape. The key is to consider the cluster (new comer)-cluster (ready-existing) interaction. Because ferroelectrics (relaxor ferroelectrics, in particular) generate a macroscopic domain pattern with decreasing temperature through its phase transition (i.e., Curie) temperature originated from micro-micro domain interaction from an elevated temperature, similar fractal behavior can be anticipated. We will discuss the dielectric relaxation and loss in terms of the micro-micro domain interaction in Section IV.
B. Fractal Dimension and Scaling
Fractal dimension is defined as follows: There are N particles with each radius ri, which make a cluster. Average cluster radius R can be estimated by:
R = (∑iri2/N)½ (1)
If the number of particles N is related with R as
N ~ RD (2)
D is called "fractal dimension".
Let us consider an example pictured in Figure. 3. We consider a small square particle in a 2-D cluster with a radius R (Euclidean dimension = 2). If there is no particle-particle interaction and a circle is fully filled (i.e., Tiling) Figure. 3(a), since Area = π•R2, its fractal dimension is 2. However, like a snowflake, if particles will not reach to the branch joint part Figure. 3(b), the number N is reduced, leading to a smaller D than 2 (1 < D < 2).

Figure 3: Schematic illustration for the states: (a) No cluster-cluster interaction (D = 2), and (b) with cluster-cluster interaction (1< D < 2).
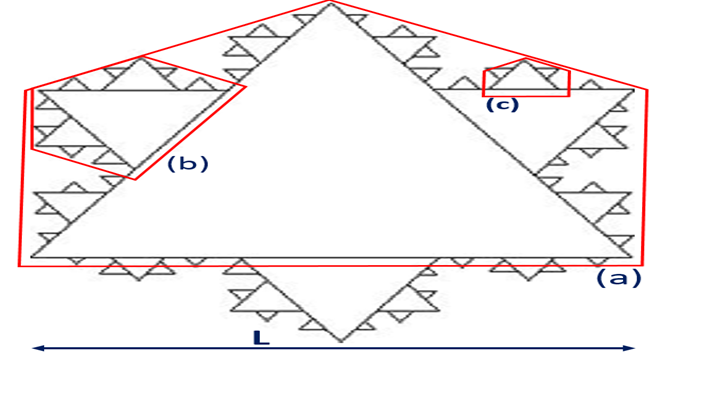
Figure 4: Characteristic length L of a Koch's snowflake created by an iterative process of equilateral triangles. Self-similarity is maintained from (a), through (b) to (c). Koch fractal dimension D = 1.26.
Another Koch curve example is pictured in Figure. 4. This snowflake-like Figure is generated based on an equilateral triangle. ⅓-length equilateral triangles are aligned iteratively on the large triangle edges. Self-similarity can be maintained with reducing the scale from (a), through (b) to (c). A rough diameter of the Figure L is called "characteristic length". If the contour length P is related with L as
P ~ LD (3)
D is another fractal dimension. The D for the Koch curve is known to be D = 1.26[9]. You can imagine that if there is a specific self-similarity in the shape/contour, the fractal dimension D may be smaller than the Euclidean dimension d. Though knowing the fractal dimension D does not provide a concrete idea on the contour shape, it will provide at least the suggestion that there may be a sort of cluster-cluster interaction and that we may expect a self-similarity in the domain contour shape
Supposing that a contour shape is a function f(r) and scaling parameter is λ, this function should keep
f(λr) = g(λ).f(r) (4)
This is known as "scaling law". By treating Eq. (4) as
f(λμr) = g(λμ).f(r) = g(λ).f(μr) = g(λ).g(μ).f(r)
We obtain an important relationship
g(λμ) = g(λ).g(μ) (5)
Leading to the power law for the function g(λ):
g(λ) = λp (6)
Here, p can be non-integer.
[N.B: From Eq. (5), ∂.g(λµ)/∂.µ = λg'(λµ) = g(λ)•g'(µ). Putting µ = 1 and g'(µ = 1)= p, we obtain the equation g'(λ)/g(λ)=d(ln g(λ))/dλ = p/λ. Thus, we obtain Eq. (6)]
III. Domain and Dielectric Properties
The relationship between the domain structure and its dielectric property is considered in this Section.
A. Domain Dynamics in Ferroelectrics
First, we exhibit domain dynamic reorientation mechanisms under electric field observed for typical normal ferroelectric BaTiO3(BT) at room temperature Figure. 5(a)and relaxor ferroelectricPb(Zn1/3Nb2/3)O3(PZN) at 100°C Figure. 5(b)[10].The electric field was applied along the spontaneous polarization direction(from the bottom to top of the pictures); that is, [100] and [111] of the perovskite axes, respectively in BT and PZN. Typical 45° angled domain walls in BT with respect to the [100] perovskite orientation move perpendicularly to the domain planes independently each other (i.e., tetragonal 90°-domain reorientation), and disappear almost completely with increasing the eternal field much higher than the coercive field. That is, the domain walls move 1-dimensionally. To the contrary, in PZN, "spindle-like" domains (i.e., rhombohedral non-180° (or 73°)-domain walls become slightly "fat" without changing the length much with increasing the external field. The color reversal between black and white corresponds to the 180°-domain reversal (i.e., polarization reversal).Note that the domain walls do not disappear even under a large electric field, but just stay with breathing-like cyclical motion. That is, the domain walls move primarily 2-dimensionally.
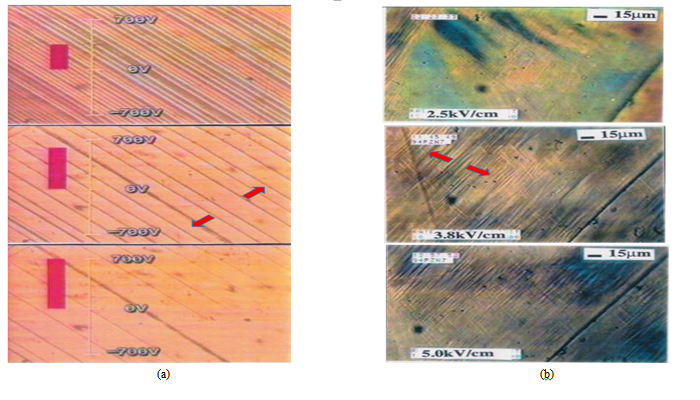
Figure 5: Domain reorientation dynamics under electric field: (a)normal ferroelectric BaTiO3 and (b) relaxor ferroelectric Pb(Zn1/3Nb2/3)O3 crystals[10].
B. Domain and Dielectric Relaxation
More intriguing phenomena are observed in the relation of the dielectric property and domain structure. Refer to Figures. 6(a) and 6(b), which show dielectric constant vs. temperature curves and domain patterns in the pure PZN single crystals at room temperature (RT): (a) for an un-poled sample, and (b) for a poled sample[11]. The domain picture at RT for the poled sample clearly exhibits relatively macroscopic domains (spindle-like with 3µm wide and 30~50μm long), while for the un-poled (or annealed) sample, the picture does not exhibit visible domains, because the domain size seems to be too small (i.e., micro (or nano) domains). In the un-poled sample, significant dielectric "relaxation" (i.e., large frequency dependence of the permittivity) can be observed in the whole temperature range below the Curie region; while in the poled sample, both dielectric constant value and dielectric relaxation diminish significantly in the low temperature range (RTup to 105°C). Furthermore, relatively large dielectric loss tan δ in the un-poled sample reduces dramatically when the macro domains are observed. Just around 105°C, where the macroscopic domain pattern becomes invisible (i.e., micro (nano)-domain), both permittivity and dielectric loss jump up, associated also with dielectric relaxation. We can conclude thus:
1. The dielectric relaxation phenomenon and high dielectric loss tan δ in the un-poled PZN seem to be originated from the micro-domain dynamics.
2. There seems to exist a sort of transition, macro-to-micro domain change, around 105°C in PZN.
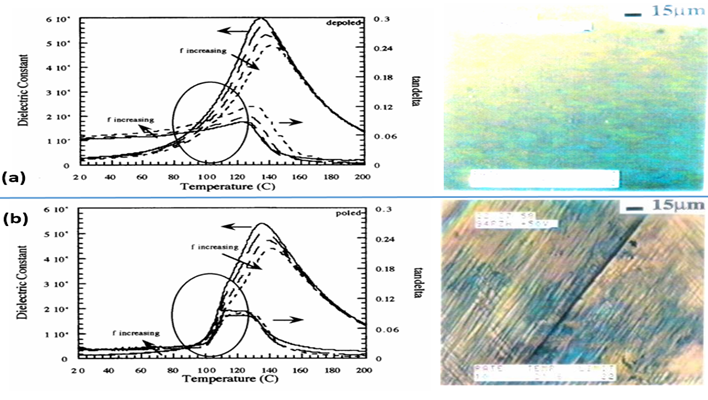
Figure 6: Dielectric constant vs. temperature curves and domain patternsaPb(Zn1/3Nb2/3)O3 single crystal: (a) for an un-poled sample, and (b) for a poled sample[11].
IV. Critical Exponent In Relaxor
We discuss on the critical exponent γ in the relation between the dielectric constant and temperature (or hydrostatic pressure) in this section[2]. A high correlation of the γ value with the phase transition diffuseness has been found empirically, which is discussed based on the fractal viewpoint.
A. Smolenskii's Model
Complex perovskite-type ferroelectrics with disordered caption arrangements, in general, reveal a very diffused or smeared phase transition. In particular, in the temperature dependence of the dielectric constant, a large deviation from the well-known Curie-Weiss law (i.e., ε - ε∞ = C/(T – T0), where ε∞ is the dielectric constant measure dat an optical-range frequency) is observed in a wide temperature range around the transition point. This is demonstrated in Figure. 7(a), which shows the reciprocal dielectric constant [(1/ε) - (1/εm)] versus temperature (T – Tm) relation for a Pb(Mg1/3Nb2/3)O3PMN single crystal (i.e., convex curve). The notations εm and Tm refer to the maximum dielectric constant and the corresponding temperature (i. e., average Curie temperature). Since the dielectric constant ε∞ is considerably smaller than the static ε in the samples treated in this paper, it may be neglected in the formula.

Figure 7: Reciprocal dielectric constant [(1/ε) - (1/εm)] of PMN as functions of temperature (T – Tm) (a), and of (T – Tm)² (b)[2].
Smolenskii[12] and Kirillov et a1.[13] Pointed out that for ferroelectrics with a diffused phase transition (i.e., relaxor ferroelectrics), a quadratic relation between the dielectric constant and temperature [(1/ε)–(1/εm)]= B(T – Tm)², gives better fitting to the experimental data. This "quadratic law" has been derived theoretically on the basis of a microscopic composition-fluctuation model[12, 13]. Refer to Figure. 8. When we assume that the statistical composition fluctuation in a complex perovskite produces microscopic regions each of which has similar dielectric characteristics, but a slightly different Curie temperature Figure. 8(a), and also that the distribution of the Curie temperature TC is of a Gaussian type:
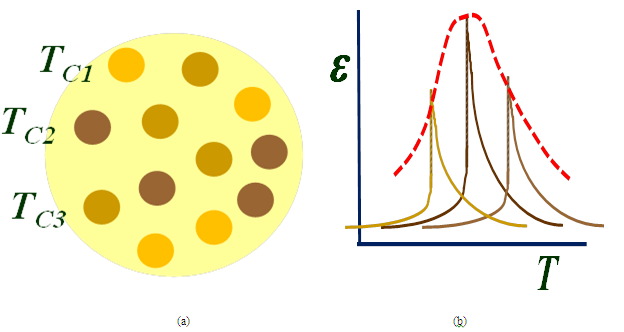
Figure 8: Smolenskii/Kirillov model:Distribution of the local Curie temperature TC is of a Gaussian type.
f(TC) ~ exp[-(Tc-Tm)²/2σ²] (7)
The reciprocal dielectric constant is represented by
ε-1(T) = ∫0∞ε-1(T,Tc)f(Tc)dTc/∫0∞f(Tc)dTc (8)
Where σ is a standard deviation of the Gaussian function[14, 15].It is notable that the Gaussian distribution supposed basically no strong interaction between microscopic regions/ clusters each other. The reciprocal permittivity of each micro-region is supposed to obey the Curie-Weiss law of the first-kind phase transition as follows:

Where C and Δ are the Curie-Weiss constant and the difference between the Curie temperature TC and the Curie-Weiss temperature T0 Figure. 8(b).
When σ is relatively large (i. e., very diffused), this theoretical treatment derives two approximate formulas for the extreme cases; T – Tm << σ and T – Tm>> σ. In the former case, the reciprocal permittivity is reduced into
ε-1(T)= εm-1exp[–(TC – Tm)²/2σ²] (10)
A series expansion, neglecting terms with (T – Tm)4 and the higher, gives the quadratic law of
[(1/ε) - (1/εm)] = (T – Tm)²/2εmσ² (11)
On the other hand, in the case of T – Tm>>σ, the temperature dependence of the permittivity approaches to the normal Curie-Weiss law.
Figure 7(b) shows the reciprocal permittivity plotted as a function of (T – Tm)². The experimental plots deviate remarkably from a straight line (i. e., concave curve) in the temperature range near the averaged Curie point (T – Tm < 30°C), and do not deviate in the higher temperature range (T – Tm>> σ ~ 45°C)[14]; this suggests, strictly speaking, a kind of discrepancy of the above-described Smolenskii's theoretical model.
B. Crital Exponent of Permittivity
The discrepancy of the curve fitting in Figures 7(a) and 7(b) may be related with the Gaussian distribution by neglecting the micro domain- micro domain interaction. Actually, we can expect a fractal phenomenon due to the domain-domain interaction. On this background, we tried at first to establish some empirical rules which can represent the real phenomenon much better.
In this paper, we have determined the critical exponent γ precisely in a generalized form of
[(1/ε) – (1/εm)] = C'-1(T – Tm)γ (12)
Not only for relaxor ferroelectrics, but also for normal sharp-transition ferroelectrics, so that Eq. (12) may provide the best fit to the experimental results. Moreover, another critical exponent γ* of the permittivity with respect to hydrostatic pressure p, which is given by
[(1/ε) – (1/εm)] = C*-1(p – pm)γ* (13) has also been determined for the same samples.
1. Temperature dependence of permittivity: Single crystals of Pb(Mg1/3Nb2/3)O3 (PMN) and Pb(Zn1/3Nb2/3)O3(PZN) with a very diffused phase transition, BaTiO3 (BT) and K(Ta0.55Nb0.45)O3 (KTN) with a sharp phase transition, and a solid solution crystal 0.88Pb(Zn1/3Nb2/3)O3- 0.12PbTiO3 (0.88PZN-0.12PT) have been used for our dielectric measurements. Cut into arectangular plate with the polarization direction normal to thesurface, the crystal was silver-electroded, then electrically poled. The capacitance was precisely measured at 1 kHz and 1 MHz with an automatic capacitance bridge (Hewlett-Packard 4270A) up to about 200°C above the average transition temperature. The differenceof the permittivity between the poled and unpoled samples was hardly observed in the temperature range above the Curie point.
Figure 9 shows logarithmic plots of the reciprocal permittivity [(1/ε) - (1/εm)] measured at 1 kHz as a function of temperature (T – Tm). The linearity of the curves is remarkably good except in a narrow temperature range above the peak Tm (T – Tm< l °C) for all the samples. The critical exponent γ of the reciprocal permittivity with respect to temperature has been determined from the slope of the straight line in the range of 5°C < T - Tm< 200°C: γ = 1.08 for BT, 1.17 for KTN, 1.58 for 0.88PZN-0.12PT, 1.64 for PMN and1.76 for PZN. Note that this γ is different from the conventional critical exponent defined for sharp-transition ferroe1ectrics such as BT in a very close vicinity of the Curie temperature (T - TC< 1°C).
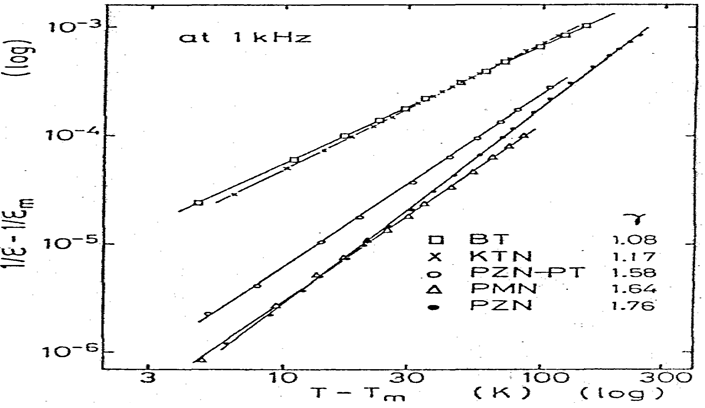
Figure 9: Logarithmic plots of the reciprocal permittivity [(1/ε) - (1/εm)] at 1 kHz versus temperature (T – Tm) relation for BaTiO3 (BT), K(Ta0.55Nb0.45)O3 (KTN), 0.88Pb(Zn1/3Nb2/3)O3-0.12PbTiO3(0.88PZN-0.12PT), Pb(Mg1/3Nb2/3)O3 (PMN) and Pb(Zn1/3Nb2/3)O3 (PZN). Note the good linearity for all the samples. The γ values were determined in the temperature range of 5°C < T - Tm< 200°C.[2]
Table 1: Critical exponents of the permittivity γ and γ*, and the Curie-like constant C' for relaxor and normal-transition ferroelectrics.
| Substances | γ | C' (x105) | γ* |
|---|---|---|---|
| BaTiO3 | 1.08 | 2.1 | 1.0(a) |
| K(Ta0.55Nb0.45)O3 | 1.17 | 2.9 | 1.00 |
| 0.88Pb(Zn1/3Nb2/3)O3-0.12PbTiO3 | 1.58 | 63 | - |
| Pb(Mg1/3Nb2/3)O3 | 1.64 | 140 | 1.66 |
| Pb(Zn1/3Nb2/3)O3 | 1.76 | 200 | - |
(a) Reference[17].
Table 1. summarizes the critical exponent γ and the Curie-like constant C' for all the samples. It is important to mention here that the relaxor ferroelectric sreveal a large relaxation of the permittivity and also that the exponent γ might be changed with the measuring frequency. PMN, for example, shows a gradual decrease in the permittivity ɛ and a monotonous increase of the peak temperature Tm with changing the measuring frequency from 1 kHz to 1 MHz, as is inserted in Figure 10(a). Figure 10(a) and 10(b) show the [(1/ε) - (1/εm)] versus (T – Tm) plots for PMN and PZN, respectively, measured at 1 kHz and 1 MHz. The critical exponent γ seems to be insensitive to the frequency change at least in the range below 10 MHz, while the constant C' varies with the frequency.
2. Pressure dependence of permittivity: The effect of hydrostatic pressure on the dielectric constantwas also investigated up to 6 kbar for PNN and KTN single crystals. Pressure was generated in an air-driven intensifier pump (Pressure Products Industries) and transmitted through the pressure medium of Plexol. Applied pressure was monitored by a Heise Gauge with theaccuracy of ± 5 bar. Temperature was varied with a lamp heaterand a CA thermocouple was set inside the pressure cell.
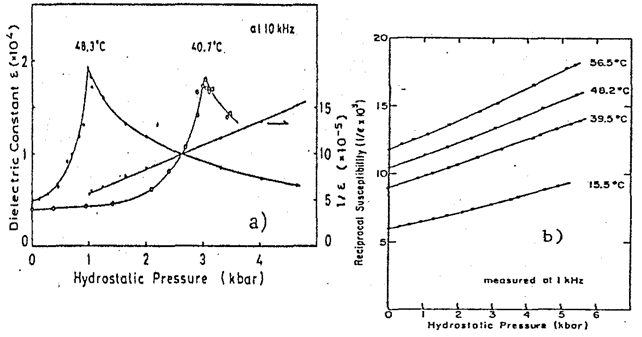
Figure 11(a) and 11(b) show isotherms of the permittivity and its reciprocal for KTN [16] and PMN[14], respectively, measured as a function of hydrostatic pressure. A good linear relation between the reciprocal permittivity and hydrostatic pressure (similar to the Curie-Weiss law) is obtained for KTN above a critical pressure pm which induces the ferroelectric-Para electric transition, whereas gradual increase of the slope is observed for PMN with increasing pressure (i.e., convex curve). Therefore, a new critical exponent γ* of the permittivity with respect to pressure can be introduced by the definition of Eq. (13). Figure 12(a) and 12(b) show logarithmic plots of the reciprocal permittivity (1/ε - 1/εm) as a function of hydrostatic pressure (p – pm). Since the critical pressure pm where the permittivity reveals the maximum could not be observed practically for PNN in our measurement above room temperature, we used a hypothetical pm (T) which is calculated for each observation temperature as
pm (T) = (T -Tm) /[∂Tm(p)/∂p] (14)
Where ∂Tm(p)/∂p is a constant of –4.8 [K•kbar-1][14]. The slope gives the exponent γ* for each case: γ* = 1.00 for KTN and 1. 66 for PMN. The critical γ* exponents are also summarized in Table 1, including the value for BT reported by Samara[17].
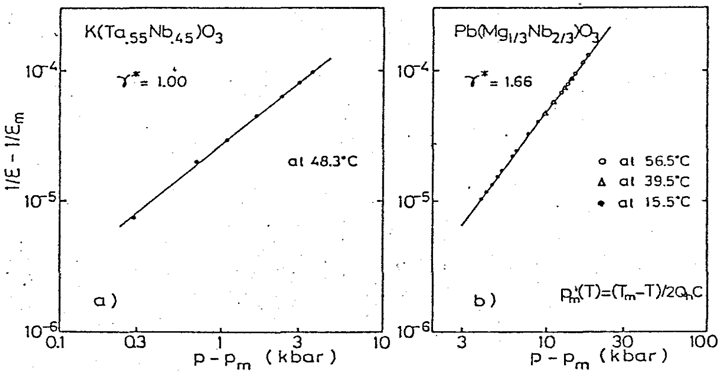
Figure 12: Logarithmic plots of the reciprocal permittivity[(1/ε) - (1/εm)vs. hydrostatic pressure (p – pm) relation for KTN (a) and for PMN (b).
C. Critical Exponent Discussion
It is worth noting the correlation between the critical exponent γ and the phase transition diffuseness. Refer to Table 1. BT revealing atypical sharp phase transition has a γ value nearly equal to 1: thiscorresponds to the Curie-Weiss law. The solid solution KTN withan "apparent" sharp transition reveals a slight deviation from the Curie-Weiss law. On the other hand, the γ value is as large as1.7 for PMN and PZN with a very diffused transition; however, thisis relatively smaller than expected for the "quadratic law" by Smolenskii[12].The solid solution PZN-PT between a relaxor and a normal-transition ferroelectrics reveals an intermediate γ value of 1.58. Thecritical exponent γ of the permittivity, determined in the temperaturerange from several to several hundreds °C above the transition point,may at least represent the degree of the phase transition diffuseness.
It is also interesting that the critical exponent γ* of the permittivity with respect to hydrostatic pressure corresponds exactly to the γ value in both the relaxor and normal ferroelectrics. This correspondence is consistently explained, if we assume that the reciprocal dielectric constant is represented by the following general formula:
[(1/ε) – (1/εm)] = C' -1(T – Tm - [∂Tm(p)/∂p]p )γ (15)
The transformation of Eq. (15),
[(1/ε) – (1/εm)] = C'-1|∂Tm(p)/∂p|γ (p – (T–Tm )/[∂Tm(p)/∂p])γ (16)
Gives the relations of
γ* = γ (17)
C* = C'|∂Tm(p)/∂p|-γ (18)
And Eq. (14), in conjunction with Eq. (13) which is the definition of the critical exponent γ*.
D. Crital exponent and fractal dimension
The critical exponent around the phase transition has not been calculated theoretically yet except for special and simple models. We review here one of the simplest models, Ising model, for receiving preliminary and intuitive idea in the relationship between the critical exponent and fractal dimension.
1. Critical phenomenon in ising model:
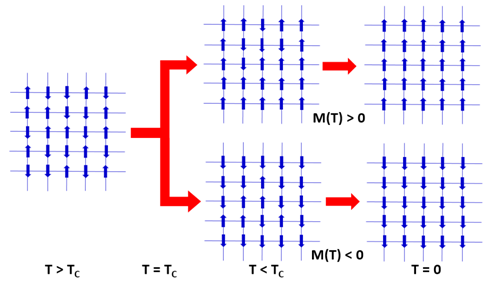
Figure 13: Visualization of magnetic phase transition (1-dimensional Ising model): Randomly oriented spins at high temperature (T>TC) are aligned blow the critical temperature TC, exhibiting spontaneous magnetization M(T) with spontaneous symmetry break. All spins align completely at T = 0 K.
A magnet model for the spin-dimension Ds= 1 (for Ising model) on the lattice dimension d = 2 (i.e., plane) is visualized in Figure 13. There are only two spin states (up or down for Ds = 1), which are denoted σX = ± 1, where x = (x, y, z, …) is the lattice point coordinate (only x and y for d = 2). We suppose that the spin-spin coupling is isotripic in terms of the space dimension and the total system energy (Hamiltonian) is provided by
EJ({σX}) = - J Σ<x,y> σx σy (19)
where <x,y> means the summation for all combination of the adjacent lattice points.When Heisenberg Exchange Coupling: J is larger than zero, σx = σy = 1 or -1 (i. e., parallel alignment) provides more stable status, and σx = 1,σy = -1 or σx = -1,σy = 1 gives higher energy status.On the other hand, when J < 0, σx = 1,σy = -1 or σx = -1, σy = 1 gives more stable status (i. e., antiparallel alignment of the adjacent spins). When we consider the effect of an external magnetic field H, extended Hamiltonian is expressed by
EJ,H({σX}) = - J Σ<x,y> σx σy - HΣxσx (20)
Summation of the second term is conducted for all lattice points, which promotes the spin alignment along the eternal magnetic field H.
When this spin system is set at a certain temperatureT atmosphere, the spin arrangement is continuously fluctuating due to the thermal fluctuation. In Boltzmann statistical thermodynamics, the probability of a certain status {σX} under an absolute temperature T can be provided by
exp[-(1/kT)EJ,H({σX})]/ Z^(T,H) (21)
Here, k is so-called Boltzmann constant, and Z^(T,H) is a normalization constant provided by
Z^(T,H) = Σσx = ±1 ,x ∈ ∧ exp[- (1/ kT) E(J,H) ({σX})] (22)
Based on these assumption, spin-spin correlation function <σx σy>^(T,H)is expressed as
<σx σy>^(T,H) = Σσx = ±1,x ∈ ∧(σx σy) exp[- (1/kT) E(J,H) ({σx})] / Z^(T,H) (23)
when the temperature T is high enough, and the external field H = 0, the two-point correlation factor (regardless of lattice dimension d) is known to follow as
<σ0 σx>(T,0)~ exp (- (|x|/ξT ).|x|)↗ ∞ (24)
<σ0 σx>(T,0) means what degree the spin σ0 at the lattice "origin" point 0 (without losing generality) is aligned with the spin σx at the lattice point x, and |x| is the distance between the origin and the lattice point x. ξ(T) is called "correlation distance", beyond which <σ0 σx>(T,0) becomes very small; in other words, the spins align generally in parallel inside ξ(T) region, but the spin alignment is not maintained beyond ξ(T). Remind the "characteristic distance" of fractal analysis in Section II, that corresponds to ξ(T). By skipping detailed discussion (refer to[8]), in rough summary as depicted in Figure 13, randomly oriented spins at high temperature (T > TC) are aligned blow a critical temperature TC (called Curie temperature), exhibiting spontaneous magnetizationM(T) with "spontaneous symmetry break". With decreasing temperature, spins align more and more, and finally completely at T = 0 K.
2. Critical exponent, fractal dimension:
We consider here most popular four critial exponents: ν, γ, η and β. The definitions are given by
v-Correlation distance: ξ(T) ~ (T - Tc)-v (25)
γ- Susceptibility: χ(T) ~ (T - Tc)-γ (26)
η– correlation function: <σ0 σx>(T,0) ~ (1/|x|d-2+n)↗ ∞ (27)
β– Magnetization: M(T)~ (TC – T)β (28)
Note that the first three exponents can be observed above the critical (Curie) temperature and on the last exponent β is for below TC.
All the critical exponents are not completely independent, but there is an important inter-relationship:
η = 2 – γ/ν (29)
If we consider the critical phenomenon at T = TC from the fractal analysis viewpoint, we can evaluate the spin-spin correlation function as
<σ0 σx>(Tc ,0) ~ (1/|x|(d - D)).|x|↗ ∞ (30)
Where D is the fractal dimension (not spin dimension Ds). Thus, by comparing Eq. (27) and Eq. (30), we obtain
D = 2 – η (31)
Leading to (from Eq. (29))
D = γ/ν (32)
Table 2 summarizes critical exponents for various Ds dimension spin models with a lattice dimension d = 3 (fcc lattice) cited from Stanley and Betts (1973)[18]. With increasing the spin dimension from 1 to ∞ (Sphere model), γincreases from 1.25 to 2. γ = 2 for the classic model seems to be rather different from the ferroelectrics (γ = 1 for classic ferroelectric phenomenology). The fractal dimension D increases very slightly (or insensitive) with Ds. To the contrary, Table 3 summarized critical exponents of the Ising model (Ds = 1) for various lattice dimension d[8]. First, it is notable that the first row of Table 2 is the same as the second row (d = 3) of Table 3, which is shadowed on the tables. Second, with increasing the lattice dimension d from 2 to 3, then 4 and higher, γ decreases from 1.75 to 1.25, then 1 finally. γ = 1 for 4 and higher dimension calculation matches exactly to the classic phenomenological model, which is popularly known as the "Curie-Weiss law". Third, with increasing the lattice dimension d from 2 to 3, then 4 and higher, the fractal dimension D increases from 1.75 to 1.96, then 2 in the Random Walk model or from 1.875 to 2.51, then 3 finally in the Percolation model.
Table 2: Critical exponents of the Ds dimension spin model with a lattice dimension d = 3 (fcc lattice)[18].
| SpinDs | ν | γ | η | β | D |
|---|---|---|---|---|---|
| 1 | 0.638 | 5/4 | 0.041 | 5/16 | 1.959*/1.959** |
| 2 | 0.675 | 4/3 | 0.04 | 1/3 | 1.96/1.96 |
| 3 | 0.70 | 11/8 | 0.03 | 11/32 | 1.97/1.97 |
| ↓ | - | (7/5) | - | (7/20) | ↓ |
| ∞ | 1 | 2 | 0 | 1/2 | 2 |
*Eq. (31); **Eq. (32)
Table 3: Critical exponents of the Ising model (Ds = 1) for various lattice dimension d[8].
| Lattice d | ν | γ | η | β | D | |
|---|---|---|---|---|---|---|
| Random Walk | Percolation | |||||
| 2 | 1 | 7/4 | 1/4 | 1/8 | 7/4 | 15/8 |
| 3 | 0.638 | 5/4 | 0.041 | 5/16 | 1.96 | 2.51 |
| 4 | 1/2 | 1 | 0 | 1/2 | 2 | 3 |
| 5 and higher | 1/2 | 1 | 0 | 1/2 | 2 | 3 |
From the analogy with the above mentioned, we reconsider the fact that the critical exponent γof the permittivity determined in the temperature range above the transition point represents the degree of the phase transition diffuseness. The γ increase may be related with the fractal dimension D decrease.
V. Acoustic Emission (AE) Under Voltage
The electric field induced acoustic emission (AE) in ferroelectric ceramics can provide information on the domain dynamics and mechanical deformation, as well as cracking. This Section treats the normal AE, which is not related with the crack propagation. This is so-called "Kaiser" effect[4, 7].
A. Acoustic emission basics
Acoustic emission (AE) method is a non-destructive technique used to detect pulses of released elastic strain energy caused by deformation, crack growth and phase change in a solid.[19] The AE method has also been used to investigate fundamental domain motions in ferromagnetic and ferroelectric materials[20,21], as well as mechanical and fatigue properties of materials.[22] In ferroelectric and piezoelectric materials, the AE method has been used to determine phase change[23-25], to detect domain reorientation[26-28] and to monitor crack propagation.[29,30]
However, our researches revealed a significant problem in most of the previous field-induced AE studies in the ferroelectrics. Acoustic waves were generated by a sample's mechanical vibration, which was caused by an electrical coupling between the power supply feedback and the piezoelectricity of sample.[31] The acoustic wave generated by the vibration was large enough to conceal the true (domain dynamics-related) AE signal and was constantly observed at high signal amplification of the AE measurement system.
1. Improved AE measurement system:
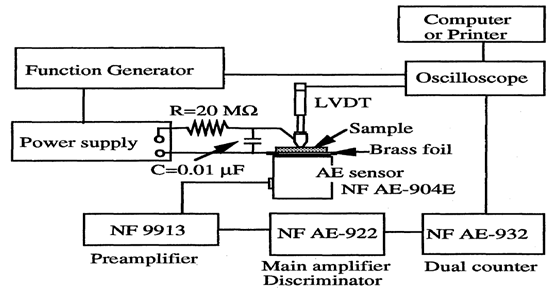
Figure 14: Improved Acoustic Emission (AE) measurement system developed in ICAT, Penn State University.[7]
Figure 14 shows the measurement system developed in International Center for Actuators and Transducers (ICAT), The Pennsylvania State University. Refer to[4] and[7] for the details. The electric field induced AE and displacement can observed simultaneously. The AE signal is detected by an AE sensor with its resonant frequency of 450 kHz. The AE signal is amplified by 40 dB through a pre-amplifier and again up to 60 dB with a main amplifier. The pre-amplifier should be operated by batteries. Otherwise, the noise on the power cable conceals the real AE signal. The amplified signal is counted after passing through a high-pass filter (100 kHz) and a discriminator. Disc specimens of commercialized ferroelectric PZT ceramic (PZT-5A) as well as, electrostrictive ceramics 0.9PMN-0.1PT and soft piezoelectric PLZT (9/65/35), with 12.7 mm in diameter and 0.4 mm in thickness were employed for the measurements. Gold electrodes were formed on both surfaces by sputtering. The AE sensor was attached to the sample through brass-foil with 0.025 mm in thickness, and silicone grease was used as a couplant to make a close adhesion. An external resistor R (R = 20 MΩ) and a capacitor C (C = 0.01 μF) were installed to the power supply in order to eliminate the electrical coupling by increasing the time constant T (= R x C) of the voltage application system (i.e., to suppress the high frequency feedback components). It should be noted that the external resistor and capacitor did not cause any electrical interference to the AE measurement system and also the intrinsic AE generations in the ceramics as long as the induced displacement was maintained and the field was applied at much lower frequency than the time constant T. The threshold level and amplification of the AE signal were changed from 400 m V at 100 dB to 400 m V at 60 dB. The samples were driven under the bipolar field at various electric field levels. The driving frequency of 0.0015 Hz was employed to obtain the saturation ofthe field induced dis-placement and AE to avoid the effect of the supplied current limited by the external resistor and capacitor.
2. Kaiser effect: The electric field induced AE generations in the piezoelectric and electrostrictive ceramics under bipolar fields is introduced. The effect of the existence of the domain structure to the AE generation can be discussed in ferroelectric lead zirconate titanate Pb(Zr,Ti)O3 (PZT) ceramics can be discussed, while the electrostrictive lead magnesium niobate-lead titanate solid solution xPb(Mg1/3Nb2/3)O3- (1-x)PbTiO3 (xPMN- (1-x)PT) can provide the AE associated with micro/nano domain dynamics. A soft piezoelectric lead lanthanum zirconate titanate Pb[1-(3x/2)]Lax(Zr1-y,Tiy)O3 (PLZT: (x/y/1- y)) ceramics may provide an intermediate (or hybrid) performance between PZT and xPMN- (1-x)PT.
In order to check complete elimination of the sample vibration and electrical noise, the fundamental "Kaiser Effect" in terms of the electric field should be monitored in ferroelectric ceramics prior to the detailed measurements[32].Results are shown in Figure. 15 for a PZT disk sample. The field induced AE will not be present after poling as long as the applied field is maintained lower than that of the poling field (i.e., Kaiser Effect). The piezo-ceramic memorizes experienced electric field or previous history. Therefore, the previous reported ferroelectric domain contributions in the field induced AE generation should be re-examined through the new AE measurement technique.
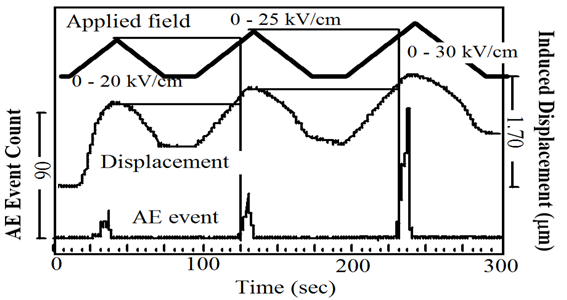
Figure 15: Kaiser effect observed in a piezoelectric ceramic.[32] The field induced AE will not be present after poling as long as the applied field is maintained lower than that of the poling field.
B. The electric field induced AE
1. AE in PZT: Figure 16(a) and 16(b) show the AE event count rate and the induced displacement of the ferroelectric PZT ceramics as a function of applied field at 0.0015 Hz with field levels of ±25 kV/cm and ±35 kV/cm, respectively. The AE measurement conditions were set to be at 100 dB with a threshold level of 400mV. A butterfly shape induced displacement was obtained. For both measurements, the AE was not observedat the coercive field at which the induced displacement took a minimum. The critical electric field, where the AE started to be generated, was slightly higher than the coercive field. This critical electric field corresponded to the point of inflection at which the second derivative of the displacement with respect to the field, d²(displacement)/dE² , changes the sign.
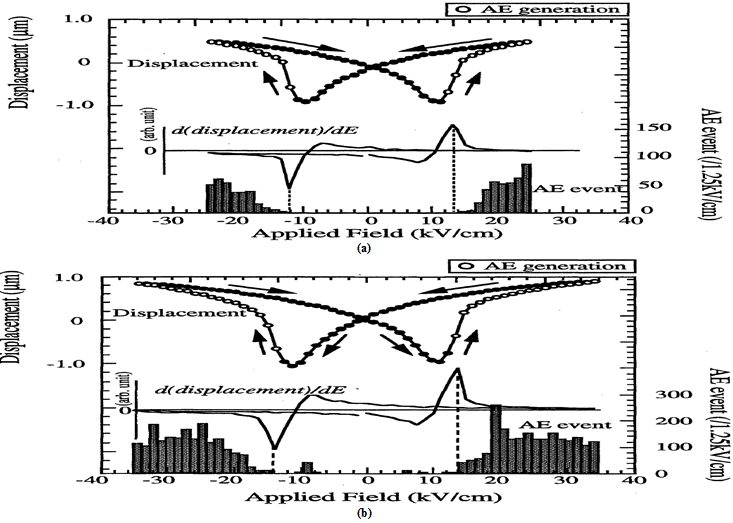
Figure 16: AE event count and the induced displacement as a function of applied electric field in a ferroelectric PZT: (a) E = ±25 kV/cm and (b) E = ±35kV/cm.[7]
In Figures 16(a) and 16(b), change of the first derivative of the displacement with respect to the field d(displacement)/dE is shown for the point of inflection, and the critical electric field corresponds to the point where |d(displacement)/dE|is the maximum. Since the displacement induction rate started to decrease in spite of the field simply increasing and the AE was present above this field, these results might indicate that a damping process for the sample deformation existed above this field and the AE was generated through that process. The AE event count rate increased with the applied field when a field of E = ±25 kV/cm was applied to the sample. For a field of E = ±35 kV/cm, the maximum of AE event count rate was not observed at the maximum applied field. The maximum event rate occurred around 27.5 kV/cm. Considering that internal stress increases with the applied field in ferroelectrics, if this observed AE was caused only by the internal stress, the AE event count rate should have increased with the applied field. Thus, this decrease in the AE event rate might suggest that the internal stress could be the origin of the AE, but not only one source. Since the induced displacement in the ferroelectric ceramics consists of the domain reorientation related deformation and piezoelectric deformation without the domain reorientation, it was assumed that the field induced AE in the PZT ceramics was generated first through domain reorientation related deformation and, after domain reorientation was completed, the piezoelectric deformation unrelated to domain reorientation which was accompanied with induced stress was expected to be the origin of the AE. The decrease in the AE event might indicate the completion of the domain reorientation related deformation.
2. AE in PMN-PT: Figure 17 shows the induced displacement and AE event count rate of the electrostrictive 0.9PMN-0.1PT ceramics. A quadratic induced displacement which showed much less hysteresis than that of ferroelectric PZT ceramics was observed. The AE count rate increased with the applied field. Because of the absence of the large domain in PMN-PT, the induced displacement might not be caused by the domain reorientation, but domain reorientation-unrelated electrostrictive deformation. It was assumed that the origin of the AE was the internal stress caused by the electrostrictive deformation unrelated to domain reorientation, resulting in the increased AE event rate with applied electric field.
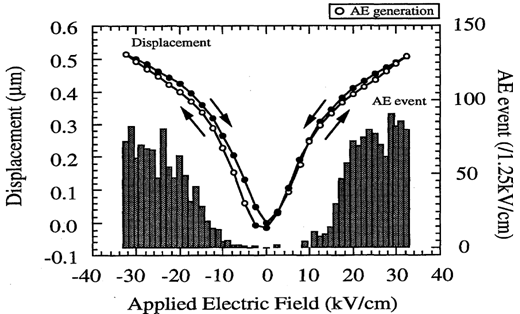
Figure 17: AE event count and the induced displacement as a function of applied field in electrostrictive 0.9 PMN-0.1 PT.[7]
3. AE in PLZT: Figure 18 shows the AE event count rate and the induced displacement of the soft piezoelectric PLZT(9/65/35) ceramics, which shows an intermediate displacement change between the ferroelectric PZT and electrostrictive PMN-PT ceramics. The AE generation started above the coercive field which was determined from the induced displacement. A peak of the AE event rate was observed around 10kV/cm, and the AE event rate increased with the applied field when a field higher than 10 kV/cm was applied. It was assumed that the peak of the AE event rate was due to the domain reorientation related deformation, and after the domain reorientation was completed, the AE was caused by the piezoelectric deformation unrelated to domain reorientation. These results suggests that both the domain reorientation related and unrelated deformations were the origins of AE in the PLZT (9/65/35) ceramics.
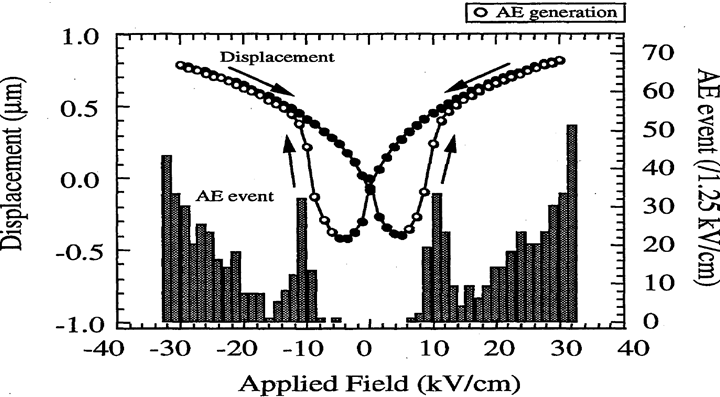
Figure 18: AE event count and the induced displacement as a function of applied field of soft piezoelectric PLZT (9/65/35)[7]
C. Fractal dimension of the electric field induced AE
A fractal analysis of the AE signal amplitude distribution, which is used in the AE method to determine the damage of materials[33], is also applied for the ferroelectrics in our research. When the AE event rate f (x) is the minus D-th power of x, where x is the AE signal amplitude,
f(x) = cx- D (c: constant) (33)
The number of D is defined as the fractal dimension[32].The integrated AE event F(x),
F(x) = ∫x∞ f(x)•dx = (1/D−1)cx–D+1 (D> 1) (34)
is observed through changing the AE signal threshold level in the measurements. If D = 1,
F(x) = ∫x∞ f(x)•dx = c ln x + A (35)
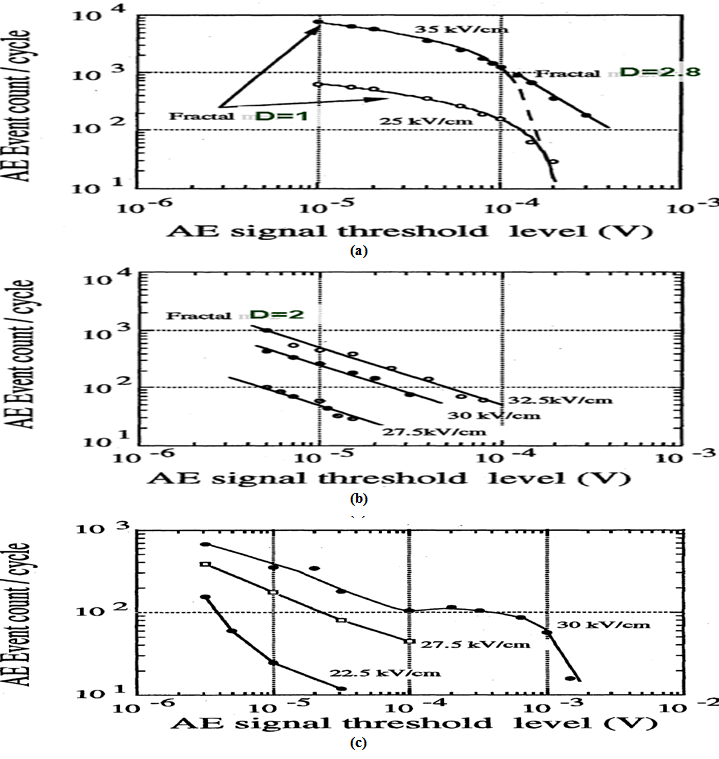
Figure 19: AE event count per cycle as a function of the AE signal threshold level: (a) ferroelectric PZT, (b) electrostrictive0.9 PMN-0.1 PT, and (c) soft piezoelectric PLZT (9/65/35).[7]
1. PZT: Figure19(a) shows the AE event count per cycle as a function of the AE signal threshold level in the ferroelectric PZTceramics. The observed AE event count logarithmically decreases with the AE signal threshold level when a field of ±25kV/cm is applied Figure 19(a). Thus, a fractal dimension of D = 1 can be obtained for the logarithmic decrease in the ferroelectric PZT. Since repeatable and stable field induced AE is observed, it is supposed that the lowered fractal dimension is due to the existence of ferroelectric domain and the effect of the do-main reorientation related deformation, instead of the dam-age. When a field of ±35 kV/cm is applied, the higher AE signal threshold level parts does not follow to logarithmic change. The lower signal threshold level region still could be fitted to a logarithmic curve and the extended line also ends around the AE signal threshold level obtained for ±25 kV/cm. The fractal dimension of higher signal threshold level part can be found to be D = 2.8. Since the domain reorientation is supposed to be completed at higher electric field, the origin of the AE with the fractal dimension of 2.8 is assumed to be piezoelectric deformation without domain reorientation. It is shown that the fractal dimension of the field induced AE for the domain reorientation related deformation (D = 1) is lower than that for the piezoelectric deformation without domain reorientation (D = 2.8).
2. PMN-PT: Figure 19(b) shows the AE event count per cycle for the electrostrictive PMN-PT as a function of the AE signal threshold level. The same slopes for the AE event count are observed at various applied fields, and the critical fractal dimension of D = 2 can be obtained. It seems that the origin of AE in the electrostrictive PMN-PT ceramics does not change with the applied field level, and was assumed to be the internal stress caused by the electrostrictive deformation unrelated to macro-domain reorientation, but by micro/nano domain dynamics.
3. PLZT: In the PLZT (9/65/35) ceramics, the AE event count fluctuated with the applied field Figure 19(c). This fluctuation in the AE is probably due to the field induced phase change and/or domain creation. It seems that the domain reorientation related deformation, the piezoelectric deformation unrelated to domain reorientation and the field induced domain creation as well as phase change related behavior cause the AE generations in the PLZT (9/65/35) ceramics. The fractal dimension of the PLZT (9/65/35) does not take a constant intermediate number between D = 1 and 2, but fluctuated. This is probably due to the change of AE generation source caused by the applied field. If we use 27.5 kV/cm AE values (close to linear), D = 1.7 can be obtained.
In partial conclusion
(1) The AE event rate in ferroelectric PZT and soft piezoelectric PLZT (9/65/35) ceramics show two origins: domain reorientation related deformation and piezoelectric deformation without domain reorient-action. On the contrary, the internal stress caused by the induced electrostrictive deformation (micro/nano domain dynamics) is supposed to be the dominant AE generation source in the electrostrictive 0.9PMN-0.1PT ceramics.
(2) The fractal dimension of the ferroelectric PZT ceramics consisted of the domain reorientation related D = 1 and the domain reorientation unrelated D = 2.8, when the electric field of ±35 kV /cm is applied. The fractal dimension of D = 2 is obtained in the electrostrictive PMN-PT. The fluctuation of the fractal dimension is observed in PLZT (9/65/35) ceramics, which show an intermediate state (D = 1.7) between PZT and PMN-PT in terms of the induced displacement.
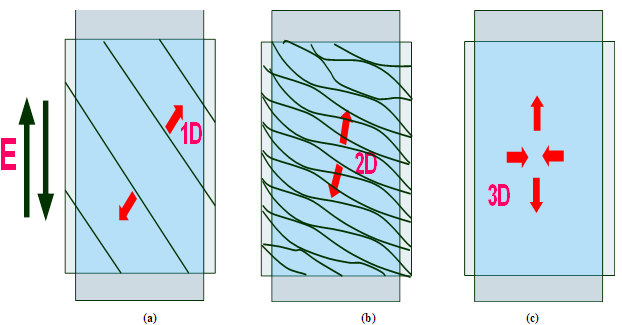
Figure 20: Intuitive domain dynamics models: (a) macro-domain reorientation;
(b) micro/nano-domain motion;
(c) piezo-striction in a monodomain state.
An intuitive domain dynamics model is illustrated in Figure. 20 for explaining the fractal dimension. Figure 20(a) depicts macro-domain reorientation in PZT under low electric field. Clear plate-like 90º-domain walls move primarily in perpendicular to the plate (1-D motion). If the AE comes from this motion, the fractal dimensions D = 1 can be explained. However, when the electric field is larger than coercive field in PZT, mono-domain state will be realized. The deformation beyond this field level is caused by intrinsic piezoelectricity (elastic deformation); that is, 3-D deformation (1-D extension associated with 2-D shrinkage). This suggests the fractal dimension D = 2.8, close to the lattice dimension 3. On the contrary, in PMN-PT, spindle-like micro-domains breathe (i.e., fatter and slimmer like a rubber tube) by keeping the length, as shown in Figure 20(b) We can imagine D = 2 from this micro-domain dynamics.
VI. Acoustic Emission (AE) Under Cracking
Though the damage or crack in ferroelectric ceramics is not our primary interest in this paper, brief description on "Felicity effect" may help with understanding the AE data practically measured.
A. Multilayer piezoelectric actuator
Multilayer ceramic actuators (MCA) are used in many applications, such as diesel injection valves for automobiles and probe positioners in scanning tunneling microscopy (STM), because of high force, electromechanical coupling and micro-displacement controllability. Thus, our primary research target in their reliability was to develop the monitoring system for clarifying the crack mechanisms. The acoustic emission (AE) method was adopted or this purpose[5,6].
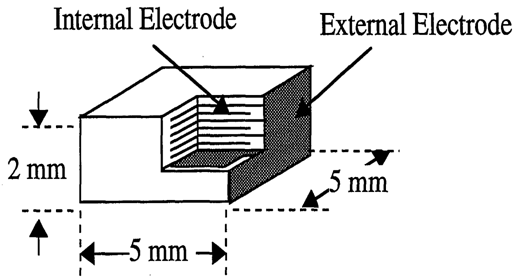
Figure 21: Multilayer piezoelectric actuator configuration: Active layer thickness = 40 μm; Displacement (0-60V) = 1.60 μm; Low field capacitance = 350 nF; Number of active layer = 48[5].
Figure 21 shows the MCA sample specifications. MCA of soft PZT is usually operated by a unipolar voltage from 0 to 60 V, which corresponds an electric field of 1.5 kV/mm, and exhibits an induced displacement of 1.6 μm. Since high local concentrated electric field around the edges of the internal electrodes cannot be determined, the applied voltage rather than field is used in this Section. Note that the internal electrode and surface buffer layers were designed intentionally for introducing the crack.

Figure 22: The AE count and induced displacement as a function of time during the poling process: poling voltage = 120 V (a), and 200 V (b)[5].
Figure 22(a) and 22(b) show the induced displacement of the MCA and the AE event count during the poling process. The poling voltage was applied at room temperature up to 120 V and 200 V, respectively. A very small value for the AE event count was observed when the MCA was poled with a peak voltage of 120 V. Different from the results in PZT single plate ceramic shown in Figure 15, the first deformation related AE at poling was not observed. AE signals in the MCA might be easily attenuated by the internal electrodes, because of the acoustic impedance mismatch. On the contrary, when a poling voltage with a peak of 200 V was applied, the AE event count rate started to increase around 140 V Figure 22(b), and continuously observed even when the voltage was decreased. This is against the normal "Kaiser Effect", and considered to be higher internal stress/strain and consequential cracking. We can conclude that the critical poling voltage for the actuator, which does not cause any major cracking, can be determined using the AE measurement.
B. Felicity effect
When elastic materials are damaged, the re-applied stress, where new emissions start, becomes lower than the previous maximum stress (The Felicity effect).[34] This decrease in the stress at the onset of AE count can be caused by a friction between free and damaged surface. The Felicity ratio is defined as follows:
Felicity ratio = σstress at onset of AE /σprevious maximum stress (36)
Figure 23 shows the induced displacement and AE event count rate for a unipolar cyclic test with a peak voltage of 180 V. In the first cycle, a large number of AE event counts started from 160 V and could be caused by both stress and cracking Figure 23(a). The AE observed during the applied voltage decrease is probably due to the friction at the damaged and un-damaged surfaces (i.e., delamination). In the second cycle, the total AE event count per cycle decreased. This is assumed to be the stress relaxation in the MCA due to cracking. A larger AE event rate than that of the first cycle was observed from 130 V to 160 V Figure 23(b). At the 10th cycle, even the overall AE event decreased, the AE onset voltage stayed around 130 V Figure 23(c).

Figure 23: The AE count and induced displacement as a function of time: (a) 1st-cycle, (b) 2nd-cycle and (c) 10th-cycle.[5].
During the cyclic test, the total AE event count decreased with number of applied voltage cycle, but the AE onset voltage was found to be around 130 V. It is supposed that the damage in the MCA sample lowered the durability against applied voltage. This damage effect on the AE generation can indicate the Felicity effect in the MCA and the Felicity ratio is calculated to be 130 V/180 V = 0.72. The Felicity ratio in terms of the applied voltage can be used to evaluate the existing damages in the MCA and to determine the maximum safety driving voltage for the MCA which will not cause any major cracking.
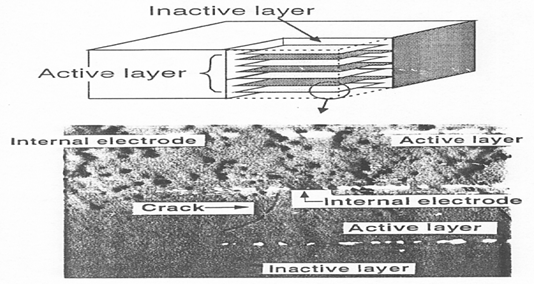
After measuring the AE event count and observing the Felicity effect in the sample, the MCA was carefully sliced and polished for microscopic observation. Figure 24 shows a micrograph of the crack actually generated in the sample poled at 200 V. Since the crack was observed in the vicinity of the internal electrode edge at an active layer next to the inactive top layer, the stress concentration caused by the inactive layer should be the origin of the cracking. The failures which can raise the destruction probability of the MCA can be detected during the poling process using the AE monitoring.
C. Fractal dimension for cracking
During the above Felicity effect measurement, we have not paid attention to carefully calculate the fractal dimension. Thus, we will cite previous researches here for the references.
Hirata reported the compressive destruction test in Granite cylinder samples[35]. Rocks usually take three stages until total collapse: (1) First creep – fast speed deformation, (2) Second creep – constant and gradual speed deformation, then (3) Third creep – accelerated speed deformation, reaching to the fatal destruction. Hirata used AE measurement associated with these creep processes to generate the AE spatial distribution map, then calculated "accumulated 2-point correlation factor" to determine the fractal dimension. The accumulated 2-point correlation follows a power law for all three stages, which indicated the fractal phenomena. The exponent provides the fractal dimension of the AE spatial distribution: first creep – D = 2.75, second creep – D = 2.66, and third creep –D = 2.25. The fractal dimension decreases with the deformation progress, and the decrease is significant immediately prior to the fatal destruction. The original space structural fluctuation of rocks has a fractal dimension around 2.8, which indicates rather uniform random distribution. As the deformation progresses, the correlation between micro cracks gradually increases and the cracks cluster prior to the fatal collapse, as monitored in fractal dimension decrease[35].
Dielectric breakdown phenomena may also be close to the piezoelectric actuator cracking. The dielectric breakdown is a successive growth phenomenon of the low-resistive part, which is initially generated by high voltage. Niemeyer et al.[36,37] simulated this growth process for a circular discharge phenomenon under a 2-D square lattice model: (1) Potential on the circle circumference (cathode) Φ = 1 V, potential at the circle center (anode) and at the connected lattice points Φ = 0. Potential at other (not connected) lattice point's Φ can be calculated with the discrete Laplace equation. (2) The growth process (extending the connected lattice cluster to an adjacent lattice point) is decided by the random probability:
P(r) = |Δ Φ(r)|η /Σ|ΔΦ(r)|η. (37)
For a case η = 1, the fractal dimensions D = 1.75, and D = 2.48 are reported, respectively for the Euclidean dimension d = 2 and 3.
VII. Fractal-Related Light Scattering Studies
We review two representative papers on light scattering on PLZT and PMN in this chapter.
A. Light Scattering Intensity and Fractal Dimension
Schuh et al. analyzed the change on time in longitudinal elastic scattering of monochromatic light (λ = 0.63 μm) under unipolar rectangular electric field pulses (duration ranging from 1 ms to 10 s)[38]. It was shown that under application of pulse series the time dependence of light intensity I(t) scattered at a fixed angle Φ is reproducible in details. This feature permitted to determine an instantaneous scattering indicatrixI(Φ)at any time from a series of consecutive measurements of I(t) for light scattered inside various fixed angles {Φ} selected by the set of ring diaphragms in angular range 0.5–7 degrees. The variation of the integrated scattered light intensity in the relaxor phase under application of a rectangular field pulse can be separated into two stages: at the switching stage (after field switch on) the intensity increases to Imax(E); during back-switching stage after field removing the scattered light intensity spontaneously recovers the initial background level Imin.
Light scattering is proportional to the structure factor[39-41]:
Isc(q) ~ S(q) ~ ∫0∞g(r) [sin(qr)/(qr)] r2dr (38)
Where g(r) is the pair-correlation function, q= (4π/λ) sin(Φ/2) the wave vector, λ the wavelength, and Φ is the scattering angle. For mass fractals with infinite scaling Eq. (38) yield the simple result:
Isc(q) ~ q − D (39)
Where D is the fractal dimension. Such behavior can be observed for light scattering in classical relaxors PST and PMN[42]. This enables to state that the scattering centers are the fractal objects.
B. Results in PLZT
Schur et al. studied hot-pressed coarse-grained (grain size 4 – 7 μm) PLZT 8/65/35 ceramics [(Pb0.92La0.08) (Zr0.65Ti0.35)O3], which exhibits a relaxor-like behavior within a broad temperature range[38]. The field-induced variation of the scattered light intensity is observed only within the temperature range from 45 to 160◦C.In their case, Eq. (39) held throughout the whole experimental angular range for temperatures only close to Tm. According to the experimental result on Isc(q) vs. q relation at 120ºC, the fractal dimension could be calculated as D = 1.7.
C. Results in PMN
Koreeda et al. reported temperature dependence of the fractal dimension in PMN with using wide-band light scattering method (GHz – THz)[43]. 200 mW level Ar laser beam illuminated a sample and back-scattered light was introduced to a spectroscope (such as Tandem Fabry-Perot Interferometer and diffraction grating monochrometer). They reported "spectrum self-similarity" in PMN single crystals, which is popularly observed in soft matters such as glass and gel materials.
Their results are cited from Ref.[44]. The fractal dimension D increases monotonously with reducing the temperature:
1. High temperature (Burns temperature 600ºC): D = 1.6
2. Intermediate range (Curie region 290ºC): D = 2 – 2.4
3. Low temperature: D = 2.6
They also pointed out that the value D = 2.6 is close to the theoretical fractal dimension D = 2.53 in 3-D percolation model [Refer to Table 3]. Koreeda is primarily adopting the 3-D percolation model for explaining the micro domain-micro domain interaction.
Summary
This paper reviewed Ferro electricity from fractal analysis viewpoints. Micro to macro ferroelectric domain growth changes the domain dynamics, leading to the changes in various physical properties such as dielectric permittivity, loss, polarization hysteresis, light scattering and acoustic emission.
A. Critical exponent and the phase transition diffuseness
Refer to Table 1. BT revealing a typical sharp phase transition has a γ value [defined by [(1/ε) – (1/εm)= C'-1(T – Tm)γ] nearly equal to 1: this corresponds to the Curie-Weiss law. The solid solution KTN with an "Apparent" sharp transition reveals a slight deviation from the Curie-Weiss law. On the other hand, the γ value is as large as 1. 7 for PMN and PZN with a very diffused transition.The solid solution PZN-PT between a relaxor and a normal-transition ferroelectrics reveals an intermediate γ value of 1.58. The critical exponent γ of the permittivity, determined in the temperature range from several to several hundreds °C above the transition point, may at least represent the degree of the phase transition diffuseness.
B. Fractal dimension in ferroelectrics
The fractal dimensions determined by acoustic emission (AE) in various normal and relaxor ferroelectrics are summarized in Table 4.The fractal dimension of the normal ferroelectric PZT ceramics consisted of the domain reorientation related D = 1 and the domain reorientation unrelated D = 2.8, when the electric field of ±35 kV /cm is applied. The fractal dimension of D = 2 is obtained in the electrostrictive PMN-PT (i.e., relaxor). The fluctuation of the fractal dimension is observed in PLZT (9/65/35) ceramics, which show an intermediate state between PZT and PMN-PT in terms of the induced displacement. The fractal dimensions in PLZT and PMN determined by light scattering experiments are also inserted for the reader's reference. Note that Koreeda's result on PMN was obtained from un-poled sample with micro-domains; our data from AE were from the poled PMN-PT or under a large electric field applied condition.
Table 4: Fractal dimension summary for various normal and relaxor ferroelectrics determined by acoustic emission and scattering light intensity measurements.
| Elastic Origin | Fractal Dimension D | Remark |
|---|---|---|
| Domain Reversal (AE) | D = 1 | Kaiser Effect |
| Micro Domain PLZT (Optical) | D = 1.7* | Scattering Light Intensity |
| Soft Piezo PLZT (AE) | D ≈ 1.7 | Kaiser Effect |
| Electrostriction (AE) | D = 2 | Kaiser Effect |
| Nano Domain PMN (Optical) | D = 2.4# | Scattering Light Intensity |
| Crack/Damage (AE) | 2.2 < D < 2.6 | Felicity Effect |
| Piezostriction (AE) | D = 2.8 | Kaiser Effect |
* Reference [38]; # Reference [39]
Though we do not have suitable theoretical tools/models at present to correlate the permittivity exponent γ and fractal dimension D, it is noteworthy that the systematic γ and D value change with phase transition diffuseness indicates a strong relationship. With promoting the domain size growth (from micro to macro) with temperature decrease and/or with external electric field increase, γ decreases from 2 to 1 and D increases from 2 to 3 (mono-domain state). However, we also point out that the critical exponent is the results for low voltage (domain reorientation unrelated), while the fractal dimension is the AE results measured under high electric field (domain reorientation related). Thus, the meaning of the fractal dimension seems to be different, as exemplified by D = 1 for large ferroelectric domain reorientation.
Acknowledgment
The author would like to acknowledge the US Office of Naval Research for continuous long-term research support to International Center for Actuators and Transducers at The Pennsylvania State University (N00014-92-J-1510, N00014-99-1-0754, N00014-08-1-0912, and N00014-12-1-1044).
References
- 1. https://www.google.co.in/search?q=snowflake+pictures&gws_rd=cr,ssl&ei=Mp64Vc6iBNG2uAT-preIAg
- 2. Uchino, K., S. Nomura,."Critical Exponents of the Dielectric Constants in Diffused-Phase-Transition Crystals". (1982) Ferroelectrics Letters44(1): 55−61.
- 3. M. L. Mulvihill, L. E. Cross and K. Uchino, "Dynamic Motion of the Domain Configuration in Relaxor Ferroelectric Single Crystals as a Function of Temperature and Electric Field".( 1995) The 8th European Mtg. Ferroelectricity, Nijmegen, July, P16-08.
- 4. Aburatani, H., Witham, J. P., Uchino, K. "Acoustic Emission in Lead Zirconate Titanate PLZT(18/40/60) Ceramics with Small Electro-striction". (1997) Japan. J. Appl. Phys36(P 1,11): 6829-6831.
- 5. Aburatani, H., Yoshikawa, S., Uchino, K., et al. "A Study of Acoustic Emission in Piezoelectric Multilayer Ceramic Actuator". (1998) Japan. J. Appl. Phys37( Part 1, No. 1): 204-209.
- 6. Aburatani, H., Uchino,K. Acoustic Emission in Damaged Ferroelectric Lead Zirconate Titanate Ceramics. (1998) Jpn J Appl Phys 37: L553-L555.
- 7. Aburatani, H., Witham, J.P., Uchino, K. A Fractal Analysis on Domain Related Electric Field Induced Acoustic Emission in Ferroelectric Ceramics. (1998) Jpn J Appl Phys 37: 602-605.
- 8. Takayasu, H. et al., "Fractal Science" (1987) Asakura Publ Co Tokyo 4 (254): 10063-10069.
- 9. Addison, P.S. Fractals and Chaos - An Illustrated Course. (1997) Institute of Physics (IoP) Publ, ISBN 0-7503-0400-6.
- 10. Kato, K., Suzuki, K., Uchino, K. Dynamic Domain Observation in Ferroelectric Single Crystals with a Diffuse Phase Transition. (1990) J Japan Ceram Soc 98 (8): 840-845.
- 11. Mulvihill, M.L., Cross, L.E., Cao, W., et al. Domain-Related Phase Transition-like Behavior in Lead Zinc Niobate Relaxor Ferroelectric Single Crystals. (1997) J Amer Ceram Soc 80 (6): 1462-1468.
- 12. Smolenskii, G.A (1970) J phys Soc Jpn 28: 26.
- 13. Kirillov, V.V., Isupov, V.A. Relaxation polarization of PbMg 1/3Nb2/3O3(PMN)-A ferroelectric with a diffused phase transition. (1973) Ferroelectrics 5(1): 3-9.
- 14. Uchino, K., Nomura, S., Cross, L.E., et al. Electrostrictive effect in lead magnesium niobate single crystals. (1980) J Appl Phys 51: 1142.
- 15. Kuwata, J., Uchino, K., Nomura, S. Diffuse phase transition in lead zinc niobate. (1979) Ferroelectrics 22(1): 863-867.
- 16. Uchino, K., Nomura, S., Cross, L.E., et al. Electrostrictive effects in potassium tantalate niobate. (1981) Ferroelectrics 38(1): 825-828.
- 17. Samara, G.A. Pressure and Temperature Dependences of the Dielectric Properties of the Perovskites BaTiO3 and SrTiO3. (1966) Phys Rev 151: 378.
- 18. Stanley, H.E. Introduction to Phase Transitions and Critical Phenomena, Clarendon Press Oxford, Chap 8.
- 19. Halmshaw, R. Non-Destructive, Testing (2nd ed.,) (1991) Edward Arnold, London Chap 2 pp: 273.
- 20. Guyot, M., Cagan, V. The acoustic emission along the hysteresis loop of various ferro and ferrimagnets. (1991) J Magn Magn Mater 101(1-3): 256-262.
- 21. Guyot, M., Merceron, T., Cagan, V. Does the magnetostriction control the acoustic emission? (1990) J Magn Magn Mater 83(1-3): 217-218.
- 22. Evans, G.A., Linzer, M. Failure Prediction in Structural Ceramics Using Acoustic Emission. (1973) J Amer Ceram Soc 56(11): 575-581.
- 23. Buchman, P. On acoustic emission from ferroelectric crystals. (1972) Solid State Electron. 15(1): 142-144.
- 24. Mohamad, I.J., Lambson, E.F., Miller A.J., et al. A threshold electric field for acoustic emission from ferroelectric Pb5Ge3O11. (1979) Phys Lett A 71: 115-118.
- 25. Kalitenko, V.A., Perga, V.M., Salivonov, I.N. (1980) Sov Phys Solid State 22: 1067.
- 26. Iwasaki, H., Izumi, M. Acoustic emission and piezoactivity during poling in PZT-like ferroelectric ceramics. (1981) Ferroelectrics 37(1): 563-566.
- 27. Saito, Y., Hori, S. Acoustic Emission and Domain Switching in Tetragonal Lead Zirconate Titanate Ceramics. (1994) Jpn J Appl Phys 33: 5555.
- 28. Arai, M., Sugawara, Y., Uchino. K. AE measurement in ferroelectrics. (1990) Proc Ultrasonic Symposium Hawaii, IEEE pp: 1197.
- 29. Furuta, A., Uchino, K. Dynamic Observation of Crack Propagation in Piezoelectric Multilayer Actuators. (1993) J Am Ceram Soc 76(7): 1615-1617.
- 30. Aburatani, H., Harada, S., Uchino, K., et al. Destruction Mechanisms in Ceramic Multilayer Actuators. (1994) Jpn J Appl Phys 33: 3091.
- 31. Aburatani, H., Uchino, K. Acoustic Emission (AE) Measurement Technique in Piezoelectric Ceramics. (1996) Jpn J Appl Phys 35: L516.
- 32. Aburatani, H., Uchino, K. Proc. 9th Int. Symp. (1996) Application of Ferroelectrics IEEE pp: 871.
- 33. Nakasa, H. Theoretical Bases and Applications of Acoustic Emission. (1st ed) (1994) Chijin Shokan, Tokyo.
- 34. Halmashaw, R. Non-Destructive Testing (2nd Ed.,) Chap 2 (1991) Edward Amold, London, pp: 273.
- 35. Hirata, T. Omori's Power Law aftershock sequences of microfracturing in rock fracture experiment. (1987) J Geophys Res 92(B7): 6215-6221.
- 36. Niemeyer, L., Pietronero, L., Wiesmann, H.J. Fractal Dimension of Dielectric Breakdown. (1984) Phys Rev Lett 52: 1033.
- 37. Niemeyer, L., Pietronero, L., Wiesmann, H.J. Niemeyer, Pietronero, and Wiesmann Respond. (1984) Phys Rev Lett 57: 650.
- 38. Shur, V.Y., Lomakin, G.G., Rumyantsev, E.L., et al. "Fractal Clusters in Relaxor PLZT Ceramics: Evolution in Electric Field". (2004) Ferroelectrics, 299(1): 75-81.
- 39. Courtens, E., Vacher, R., Stoll, E. Fractons observed. (1989) Physica D: Nonlinear Phenomena 38(1-3): 41-55.
- 40. Sinha, S.k. Scattering from fractal structures. (1989) Physica D: Nonlinear Phenomena 38(1-3): 310-314.
- 41. Hasmy, A., Foret, M., Pelous, J., et al. Small-angle neutron-scattering investigation of short-range correlations in fractal aerogels: Simulations and experiments. (1993) Phys Rev B 48(13): 9345.
- 42. Kamzina, L.S., Krainik, N.N., Korshunov, O.Y. Onset of large-scale nonuniform states under electric field-induced phase transition in lead magnoniobate crystals. (1995) Phys Solid State 37: 1523-1525.
- 43. Koreeda, A., Saikan, S., Taniguchi, H., et al. Power-Law Quasielastic Light Scattering Observed in Relaxor Pb(Mg1/3Nb2/3)O3. (2011) Ferroelectrics 415(1): 24-28.
- 44. Koreeda, A. "Fractal Dynamics in Relaxor Ferroelectrics". (2013) Bull. Japan. Ceramics Society 48 (7): 537-541.


