Household Water Treatment Technologies For Microbial Removal in Kabale District, Southwestern Uganda
Alex Saturday1*, George Lukoye Makokha1, Anthony Macharia1
Affiliation
Department of Geography, Kenyatta University, Nairobi, Kenya
Corresponding Author
Alex Saturday, Department of Geography, Kenyatta University, P.O Box 43844-00100 Nairobi, Kenya; E-mail: Saturday.alex@yahoo.com
Citation
Saturday, A., et al. Household Water Treatment Technologies for Microbial Removal in Kabale District, Southwestern Uganda. (2016) J Environ Health Sci 2(1): 1-8.
Copy rights
© 2016 Saturday, A. This is an Open access article distributed under the terms of Creative Commons Attribution 4.0 International License.
Keywords
Household water treatment; Water quality
Abstract
Health problems associated with the consumption of untreated drinking water is one of the greatest concerns in Kabale District in spite of government’s efforts to provide safe drinking water to the people. The objective of the study was to examine household water treatment technologies (HWTS) and evaluate their ability to improve the microbial quality of drinking water. We analyzed 20 paired samples (source and treated) of drinking water from four sources of drinking water in close proximity to homesteads. Samples were analyzed for total coliforms and Escherichia coli, the indicators of faecal contamination, to measure effectiveness of HWTS. The parameters were determined using membrane filtration method. Laboratory data was statistically analyzed using one way ANOVA from SPSS software version 17.0. All HWTS improved the microbial quality of drinking water under laboratory conditions. Mean log10 total coliforms reductions were 2 log10 (99.5%) for boiling, 0.9 log10 (84.8%) for biosand filtration, 1.9 log10 (99.5%) for application of Water Guard tablets and 2 log10 (98.1%) for application of aqua safe tablets. The mean log10 Escherichia coli reductions were 1.2 log10 (100%) for boiling, bio sand filtration, application of Water Guard tablets and application of aqua safe tablets. The microbial removal effectiveness of HWTS was significantly high and the differences in the mean total coliforms reductions by different HWTS were statistically significant (P < 0.05). Water Guard, bio sand filtration, boiling and aqua safe tablets significantly remove total coliforms and Escherichia coli and should therefore is promoted at local level.
Introduction
Lack of access to safe drinking water contributes significantly to the global human health burden and death resulting from infectious waterborne diseases. Globally, unsafe drinking water is a leading cause of preventable diseases, especially among children in developing countries where there is lack of sanitation. Current figures indicate that more than 700 million people globally lack access to improved water sources (WHO & UNICEF, 2014). Sub-Saharan Africa is most remarkably and disproportionately affected by lack of access to safe drinking water with 327 million people without access to safe drinking water (WHO & UNICEF, 2010, 2014).
Access to safe drinking water sources in Uganda significantly increased from 54% in 2001 to 76% in 2015 because of high level investment in water sector by the government and other development partners. However, the burden of waterborne diseases, child mortality and morbidity remain a significant challenge (WHO & UNICEF, 2015). A study by UBOS (2012) reported that 23%, and 14% of 1,096 children under the age five country wide and in southwestern part of the country respectively, had diarrhea disease before 2012 demographic health survey. The report further indicated that child mortality rate was 90 deaths per 1,000 live births. Most of these deaths were caused by diarrheal disease as a result of unsafe drinking water. Therefore, one of the most important prerequisites for improving access to drinking water in developing countries is through implementation of household water treatment in communities that are dare need of safe drinking water.
Household water treatment technologies have emerged as means to empower the local people and communities without access to safe drinking water at home (Sobsey et al., 2008). Such technologies include; filtration, boiling, solar disinfection and chemical disinfection among others. Additionally, household water treatment is one option for improving drinking water quality within the home, more especially where water handling and storage is necessary and recontamination is a real risk between point of collection and point of use (WHO & UNICEF 2011). Access to a distant water source only, unreliable piped supplies, reliance on surface waters and unprotected springs, boreholes and dug wells are crucial factors that make household water treatment and storage a necessity (WHO & UNICEF, 2011).
In Kabale District, health problems associated with drinking untreated water is one of the most significant concerns. According to UBOS (2012), 18.8% of children had diarrhea cases before the 2012 demographic health survey in Southwestern Uganda. While the Government of Uganda is taking steps to ensure access to safe drinking water supplies in rural and urban areas, HWTS provides a potential intervening solution that can reduce waterborne pathogenic bacteria (Sobsey et al., 2008). Whereas boiling method continues to be the most common HWTS, other methods such as solar disinfection, biosand filtration, combined flocculation and chlorination have been widely promoted in Uganda (Peletz et al., 2009). Although these HWTS are available to for use at household level, little work had been done to establish their microbial removal efficiency in Kabale District. Therefore, additional documentation on the effectiveness of HWTS for microbial removal in Kabale District was required.
The commonly available HWTS for laboratory testing were identified during the field study survey. These technologies were boiling, application of Water Guard tablets, Aqua safe tablets and biosand filtration. The primary outcome variables were the reduction in concentration of total coliforms and Escherichia coli following the use the selected technologies in laboratory.
Materials and Methods
Study area characteristics
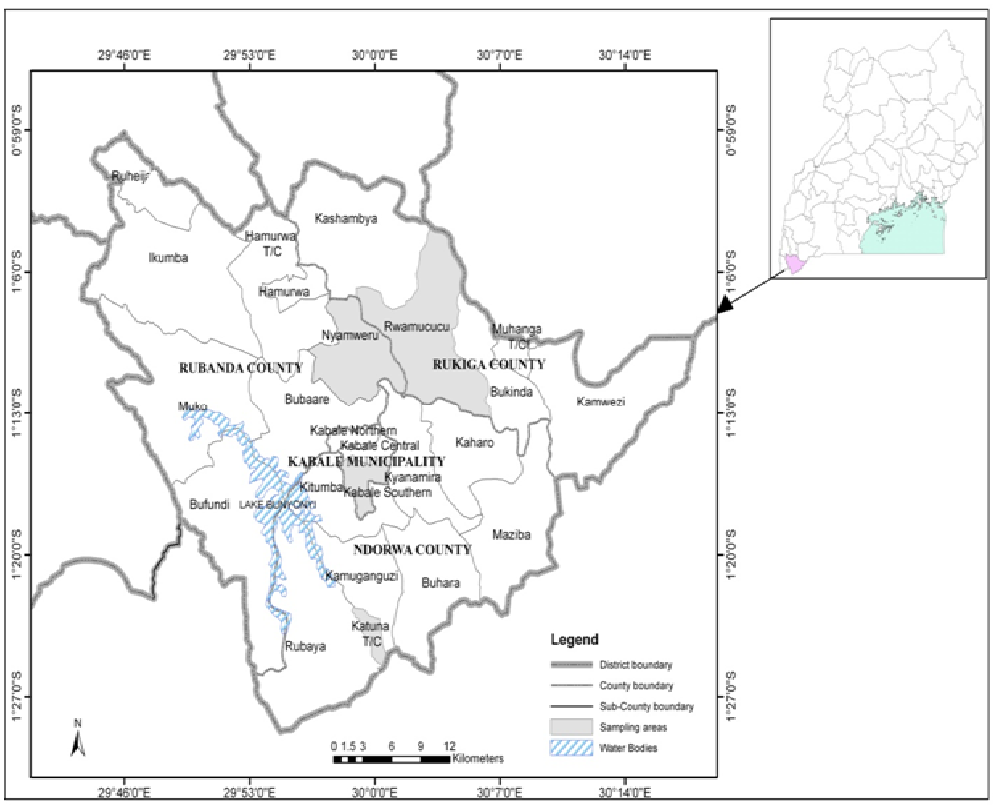
Kabale District is geographically located in Southwestern Uganda. it lies between 29° 45’ 0” E and 30° 15’ 0”E and latitudes 0° 1’ 0” S and 1° 29 0” S (Figure 1). It covers a total area of about 1,864 Square kilometers (KDLG, 2012). It borders with the Districts of Kisoro to the West, Rukungiri to the North, Ntungamo to the East and the Republic of Rwanda to the South (KDLG, 2012). Approximately 81% of households have access to safe drinking water sources (DWD, 2010). The main water sources of drinking water are public-stand pipes and protected spring technologies. Rainwater harvesting is practiced though on small scale (DWD, 2010). The study assessed the performance of boiling, biosand filtration, WaterGuard tablets and aqua safe tablets, in reducing the total coliforms and Escherichia coli in drinking water. These were the technologies that were identified during field study survey in the study area during unannounced household visits. The map of the study area is as presented in Figure 1.
Figure 1: Map showing the study area (Kabale District) in southwestern Uganda
Selection Criteria
In order to achieve the objective of this study, a field survey was conducted to identify the most used HWTS, and five HWTS that seemed to be commonly used in the study area were examined in the laboratory. These included biosand filters, boing method, application of aqua safe tablets and application of WaterGuard tablets.
Experimental Design
A biosand filter that was already in used, developed in early 1990s by David Manz, Canadian researcher based at the University of Calgary, Alberta (Buzunis, 1995) was used in this study. The biosand filter used was made of concrete filled with filter media and gravel with an outlet pipe elevated to allow the filter to maintain a layer of water above the surface of the sand to prevent it from drying out. 10 liters of water each from selected water sources were filtered in order to obtain biosand filtered samples for analysis in laboratory.
WaterGuard used in this study was developed by the Center for Diseases Control (CDC) in conjunction with the Pan American Health Organization (PAHO) (Alekal, 2005). One WaterGuard tablet was added to 20 liters of test water sample in sterile jerrican, each from selected water sources. This water was shaken thoroughly for approximately five minutes, and was allowed to settle for one hour before samples were taken for analysis in the laboratory. This same procedure was applied when preparing samples treated by application of aqua safe tablets.
To obtain water samples treated by boiling, 10 liters of water each from selected water sources were boiled to 100°C (WHO, 2004) in the medium sized saucepan using a charcoal stove made of clay soil.
Water Sample Collection
Source water samples were collected from four different water sources in Kabale District namely; Sapato, Hamwaro, Mukakyenkye and Kirigime water springs, between 2nd March 2015 and 15th May 2015. These water sources selected because they are located adjacent to homesteads serving big populations compared to other sources as established during field study visits. Test water samples were collected once from each source in sterile 20 liter plastic jerricans. Water samples were also collected in were collected aseptically in sterilized 500 ml bottles order to detect and enumerate the initial concentration of total coliforms and Escherichia coli before treatment.
All the samples were transported 4°C within six hours to national water and sewerage cooperation (NWSC) water laboratory for Kabale area and assayed for bacteriological contamination level to determine the quality of the water before and after treatment (APHA, 1981, 1995; Rice, Bridgewater, & APHA, 2012; WE Federation, 2005). For purposes of quality, the bottle corks of sampling bottles were shielded with aluminum foil in order to avoid any form of hand contamination and adhere to aseptic techniques.
Sample Processing and Analyses
We enumerated total coliforms and Escherichia coli using the membrane filtration method followed by incubation on hichrome media. Using this method, 100 ml of water were aseptically drawn from each unit of the samples and filtered through a 0.45 μm millipore filter membrane. The membrane was aseptically removed from the filtration unit by using sterile forceps and placed on the medium in the Petri-dish in a rolling motion to avoid entrapment of air. Total coliforms and Escherichia coli counts were determined by incubating the membrane filter on Hichrome media at 37°C and 44°C for 24 hours respectively.
In order to assess microbial removal efficiency of the HWTS, we compared the concentrations of total coliforms and Escherichia coli before and after treatment by HWTS in the laboratory. The enumeration of total coliforms and Escherichia coli before and after treatment was done following standard methods for the examination of water and wastewater (APHA, 1981, 1995; Rice, Bridgewater, & APHA, 2012; WE Federation, 2005).
Log10 bacterial reductions were calculated using the equation below and were converted to percentage reduction. The formula for calculating bacteria removal efficiency is shown in equations 1− 2 (Martin, 2010)
LR = log10(B.Cb ) - log10(B.Ca ) 1
PLR = (B.Cb - B.Ca) / B.Cb × 100% 2
Where: LR = log reduction, PLR = percentage log reduction, B. Cb = bacteria count before treatment, B.Ca = bacteria count after treatment.
Data Analyses
To determine microbial removal efficiency of HWTS, we entered data obtained in Microsoft excel and later performed statistical analyses in statistical package for social sciences (SPSS) version 17.0. Following checks for normality, we used parametric statistical tests like one way ANOVA to compare log-transformed total coliforms and Escherichia coli counts of paired treated and untreated water samples to determine whether there were significant differences across all the technologies.
Results
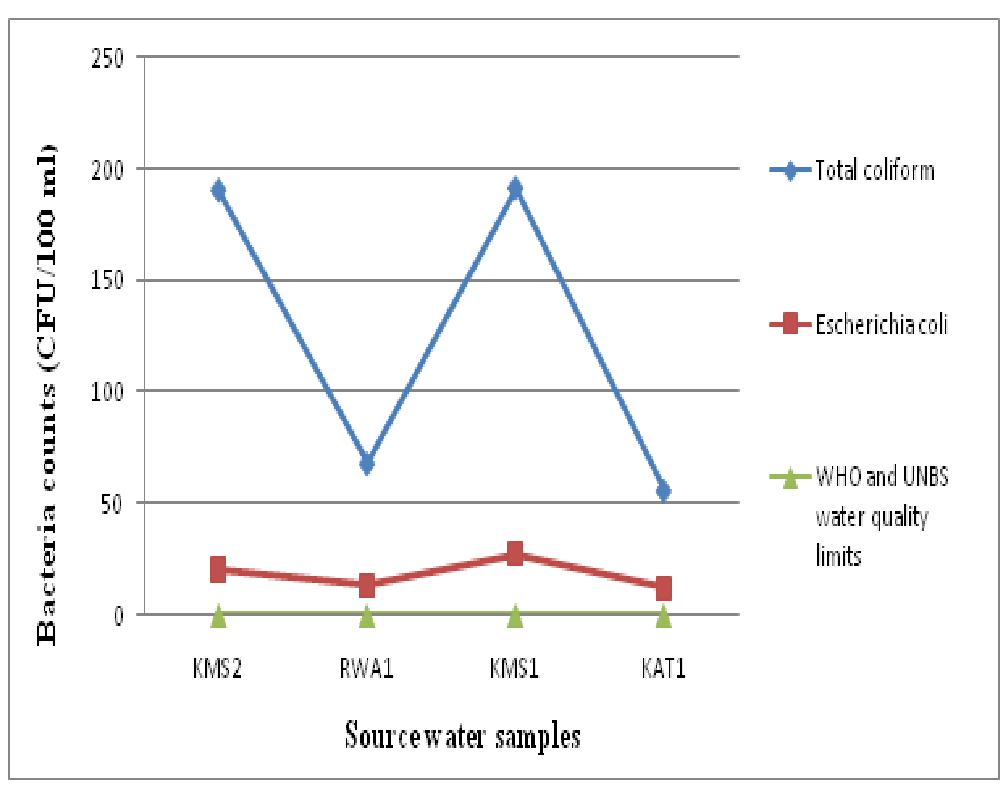
The profiles of the source water samples used in this study were found to be unsuitable for human consumption, as the concentrations of total coliforms and Escherichia coli were above the limits as per WHO (2006) and UNBS (2008) guidelines for safe drinking water. Total coliforms concentrations for each source water were 190 CFU/100 ml for KMS2, 68 CFU/100 ml for RWA1, 191 CFU/100 ml for KMS1 and 56 CFU/100 ml for KAT1, whereas Escherichia coli concentrations were 20 CFU/100 ml for KMS2, 13 CFU/100 ml for RWA1, 27 CFU/100 ml for KMS1 and 12 CFU/100 ml for KAT1 before treatment (Figure 2).
Figure 2: Line graph showing the initial concentration of total coliforms and Escherichia coli in test source water samples.
All methods achieved significant reduction in total coliforms and Escherichia coli counts. Treatment by boiling method significantly reduced total coliforms and Escherichia coli. Log10 total coliforms reduction ranged from 1.7 log10 to 2.3 log10, which corresponded with 98.4 to 100 % removal efficiency (Table 1). Log10 Escherichia coli reduction ranged from 1.1 log10 to 1.3 log10, which corresponded with 95 to 100% removal efficiency (Table 1). The overall mean log10 reduction by boiling method was 2 log10 (95% CI: 1.5 − 2.3) for total coliforms and 1.2 log10 (95% CI: 0.9 − 1.5) for Escherichia coli (Table 2 and 3).
Table 1: Total coliforms and Escherichia coli counts in test water samples after selected HWTS.
| HWTS | Water Sample | After treatment | Log10 Reductions | Percentage E. coli Removal (%) | |||
|---|---|---|---|---|---|---|---|
| Total coliforms (CFU/100 ml) | E. coli (CFU/100 ml) | Total coliforms | E. coli | Total coliforms | E. coli | ||
| Boiling | KMS2 | 3 | 1 | 1.8 | 1.3 | 98.4 | 95 |
| RWA1 | ND | ND | 1.8 | 1.1 | 100 | 100 | |
| KMS1 | 1 | ND | 2.3 | 1.4 | 99.5 | 100 | |
| KAT1 | ND | ND | 1.7 | 1.1 | 100 | 100 | |
| Biosand Filtration Method | KMS2 | 28 | ND | 0.8 | 1.3 | 85.3 | 100 |
| RWA1 | 17 | ND | 0.6 | 1.1 | 75 | 100 | |
| KMS1 | 40 | ND | 0.7 | 1.4 | 79.1 | 100 | |
| KAT1 | ND | ND | 1.8 | 1.1 | 100 | 100 | |
| WaterGuard Tablets | KMS2 | ND | ND | 2.3 | 1.3 | 100 | 100 |
| RWA1 | ND | ND | 1.8 | 1.1 | 100 | 100 | |
| KMS1 | 4 | ND | 1.7 | 1.4 | 97.9 | 100 | |
| KAT1 | ND | ND | 1.8 | 1.1 | 100 | 100 | |
| Aqua Safe Tablets | KMS2 | ND | ND | 2.3 | 1.3 | 100 | 100 |
| RWA1 | ND | ND | 1.8 | 1.1 | 100 | 100 | |
| KMS1 | 1 | ND | 2.3 | 1.4 | 99.5 | 100 | |
| KAT1 | 1 | ND | 1.5 | 1.1 | 96.4 | 100 | |
ND = None Detected
Treatment by biosand filtration achieved complete removal of Escherichia coli (Table 1). Log10 total coliforms reduction ranged from 0.6 log10 to 1.8 log10, which corresponded with 79.1 to 100% removal efficiency (Table 1). The overall mean log10 reduction by biosand filtration method was 0.9 log10 (95% CI: 0.1 − 1.9) for total coliforms and 1.2 log10 (95% CI: 0.9 − 1.5) for Escherichia coli (Table 2 and 3).
Application of WaterGuard tablets consistently produced high quality water that did not contain any traces of Escherichia coli throughout the study period (Table 1). The method removed between 1.7 log10 to 2.3 log10 of total coliforms from tested source water, which corresponded with 100% removal efficiency. Log10 total coliforms reduction ranged from 1.7 log10 to 2.3 log10, which corresponded with 97.9 to 100% removal efficiency (Table 1). The overall mean log10 reduction by application of WaterGuard tablets was 1.9 log10 (95% CI: 1.5 − 2.4) for total coliforms and 1.2 log10 (95% CI: 0.9 − 1.5) for Escherichia coli (Table 2 and 3).
Table 2: Descriptive analysis of log10 reductions by selected HWTS.
| Mean | Std. Deviation | Std. Error | 95% Confidence Interval for Mean | Min | Max | |||
|---|---|---|---|---|---|---|---|---|
| Lower Bound | Upper Bound | |||||||
| Log10 Total coliform reductions | Boiling | 1.9 | 0.3 | 0.16 | 1.5 | 2.3 | 1.7 | 2.3 |
| Biosand filtration | 0.9 | 0.6 | 0.33 | 0.1 | 1.9 | 0.6 | 1.8 | |
| WaterGuard | 1.9 | 0.3 | 0.14 | 1.5 | 2.4 | 1.7 | 2.3 | |
| Aqua Safe | 2 | 0.4 | 0.19 | 1.4 | 2.6 | 1.5 | 2.3 | |
| Total | 1.7 | 0.6 | 0.14 | 1.4 | 2 | 0.6 | 2.3 | |
| Log10 E. coli reductions | Boiling | 1.3 | 0.2 | 0.07 | 0.9 | 1.5 | 1.1 | 1.4 |
| Biosand filtration | 1.3 | 0.15 | 0.07 | 0.9 | 1.5 | 1.1 | 1.4 | |
| WaterGuard | 1.3 | 0.15 | 0.07 | 0.9 | 1.5 | 1.1 | 1.4 | |
| Aqua Safe | 1.2 | 0.15 | 0.07 | 0.9 | 1.5 | 1.1 | 1.4 | |
| Total | 1.2 | 0.13 | 0.03 | 1.2 | 1.3 | 1.1 | 1.4 | |
Application of aqua safe tablets consistently produced drinking that did not contain any Escherichia coli counts throughout the study period (Table 1). Log10 total coliforms reduction ranged from 1.5 log10 to 2.3 log10, which corresponded with 96.4 to 100% removal efficiency (Table 1). The overall mean log10 reduction by application of aqua safe tablets was 2 log10 (95% CI: 1.4 − 2.6) for total coliforms and 1.2 log10 (95% CI: 0.9 − 1.5) for Escherichia coli (Table 2 and 3).
Table 3: Descriptive analysis of percentage log10 reductions of total coliforms and Escherichia coli by selected HWTS.
| HWTS | Mean | Std. Deviation | Std. Error | Min | Max | |
|---|---|---|---|---|---|---|
| Percentage Total Coliform Reductions | Boiling method | 99.5 | 0.7 | 0.4 | 98.4 | 100 |
| Biosand filtration | 84.9 | 10.9 | 5.5 | 75.0 | 100 | |
| WaterGuard tablets | 99.5 | 1.1 | 0.5 | 97.9 | 100 | |
| Aqua Safe tablets | 98.9 | 1.7 | 0.8 | 96.40 | 100 | |
| Total | 95.5 | 8.2 | 2.0 | 75.0 | 100 | |
| Percentage E. Coli Reductions | Boiling method | 98.8 | 2.5 | 1.3 | 95.0 | 100 |
| Biosand filtration | 100 | 0.0 | 0.0 | 100.0 | 100 | |
| WaterGuard tablets | 100 | 0.0 | 0.0 | 100.0 | 100 | |
| Aqua Safe tablets | 100 | 0.0 | 0.0 | 100.0 | 100 | |
| Total | 99.7 | 1.3 | 0.3 | 95.0 | 100 |
As shown in table 4, one way ANOVA tests yielded no significant variations among Log10 Escherichia coli reduction values by different HWTS (P > 0.05). This finding indicates that performance of these technologies in removing Escherichia coli from drinking water was comparable. In addition, ANOVA tests yield significant variations among log10 total coliform reduction values (p < 0.05). This finding implies that these technologies were generally performing differently in removing total coliforms from drinking. Table 1- 4.
Table 4: One-way ANOVA results showing the relationship between log10 reductions by selected HWTS.
| Sum of Squares | df | Mean Square | F | Sig. | ||
|---|---|---|---|---|---|---|
| Log10 E. Coli Reductions | Between Groups | 0.000 | 3 | 0.000 | 0.000 | 1.000 |
| Within Groups | 0.270 | 12 | 0.022 | |||
| Total | 0.270 | 15 | ||||
| Log10 Total Coliforms Reductions | Between Groups | 2.723 | 3 | 0.908 | 5.935 | 0.010 |
| Within Groups | 1.835 | 12 | 0.153 | |||
| Total | 4.558 | 15 | ||||
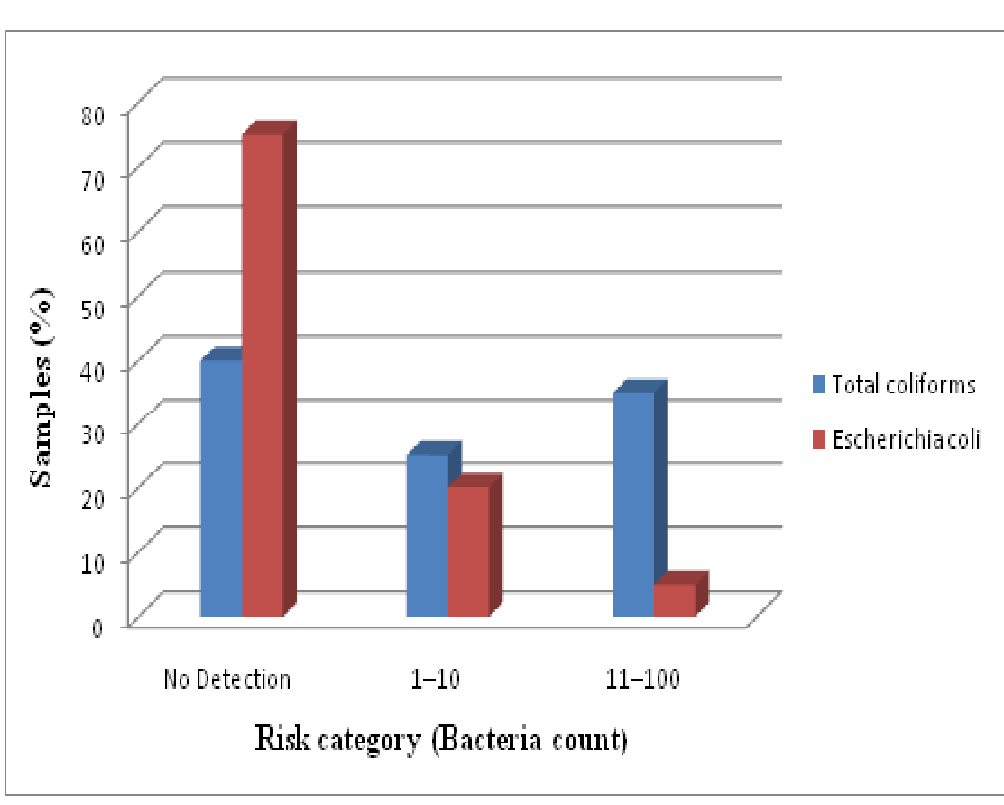
Using WHO (2006) and UNBS (2008) guidelines for drinking water, no total coliforms and Escherichia coli should be detected in 100 ml of any drinking water. By this declaration, samples that had no detectable total coliforms and Escherichia coli were fit for drinking whereas those whose concentration was > 1 CFU/100 ml were not fit drinking but at different risk level categories. The study further revealed that 40% of treated samples were free of total coliforms whereas 25% were fell within the low risk category (1 to 10 CFU/100 ml), 32.6% fell within medium risk category (11 to 100 CFU/100 ml) and 35% fell within high risk category (101 to 1000 CFU/100 ml).
As shown in figure 3, majority of treated water samples (75 %) were free of Escherichia coli, whereas 20% fell within the low risk category (1 to 10 CFU/100 ml), and only 5% fell within medium risk (11 to 100 CFU/100 ml). Figure 3.8 clearly illustrates this distribution according to risk level category. Figure 3
Figure 3: Bar graph showing the percentage of test water samples under different risk level categories.
Discussion
All HWTS improved microbial water quality in the laboratory (Table 2). This study was unique among other studies on the performance of HWTS in that testing effectiveness of technologies using water from different sources enabled the direct comparison of four technologies in the laboratory. There were no significant differences in Escherichia coli removal effectiveness achieved across technologies. Majority HWTS significantly removed total coliforms and Escherichia coli, which is consistent with WHO criteria for “protective” treatment of drinking water on the basis of bacterial reduction, which requires a mean bacteria reduction of 99% (WHO, 2011). Although log reduction values were significantly high across all HWTS, 60% and 25% of treated samples tested for total coliforms and Escherichia coli concentrations respectively did not meet safety criteria of < 1 CFU/100 ml (Figure 3).
Application of Aqua safe and WaterGuard tablets were promising household water treatment methods identified in this study. The mean log10 reduction of aqua safe tablets was 2 log10 (98.9%) for total coliforms and 1.2 log10 (100%) for Escherichia coli. The mean log10 reduction of WaterGuard tablets was 1.9 log10 (99.5%) for total coliforms and 1.2 log10 (100%) for Escherichia coli. This study finding is consistent with Crump et al. (2004), who found out that sodium hypochlorite reduced Escherichia coli concentration ns to < 1 CFU/100 ml in water sources with low and medium turbidity.
In a related study, WaterGuard tablets proved significantly more effective than other water treatment methods such as PUR and filters to produce drinking water under the detection limit (< 1 CFU/100 ml) across all water sources (Albert, Luoto, & Levine, 2010). The study further reported that when homes were assigned WaterGuard tablets, 51% of stored drinking water samples had Escherichia coli < 1 CFU/100 ml (95% CI: 46 − 56%). When the same households were provided PUR, it was noted that 33% had Escherichia coli concentrations < 1 CFU/100 ml, and when provided filters, 39% had Escherichia coli < 1 CFU/100 ml (Albert, Luoto, & Levine, 2010). In this study, the performance of both aqua safe tablets and application WaterGuard tablets in removing total coliforms from KMS1 sample was slightly lower compared to other samples, probably because of much higher turbidity observed. The physical-chemical properties of source water have been observed to limit bacterial reduction application of aqua safe tablets (Levy et al., 2014; Mohamed et al., 2015). Turbidity is known to negatively affect water disinfection by chlorine (Mohamed et al., 2015) by exerting chlorine demand.
Although WaterGuard and aqua safe tablets significantly improved the quality of drinking water, their uptake is relatively low compared to other technologies like boiling. In a study by Firth et al. (2010) conducted in a rural South Indian village, 83% of the women expressed dissatisfaction with chlorine use due to the smell and taste. In the same study, respondents revealed that, after the overhead government water tanks were treated with bleach powder, they would wait for two to three days to draw water from the tanks in order to allow the chlorine taste to recede from water (Firth et al., 2010). Kotlarz et al. (2009) revealed that treating turbid drinking water with chlorine may make the water portable, but it does not reduce the cloudy, dirty look of the water, thus making it difficult at times to convince end-users that the water has been purified.
Boiling method achieved a mean overall total coliforms reduction of 2 log10 (99.5%) consistent with a study conducted from peri-urban India where boiling reduced total coliforms by 99% (n = 1088 (Clasen et al., 2008). Mean Escherichia coli reduction by boiling methods was 1.2 log10 (98.8%). Estimates from other related studies indicated low faecal bacteria reductions by boiling. Treatment by boiling in rural Guatemala and Vietnam reduced total coliforms by 86.2% and 97% respectively (Rosa et al., 2010 & Clasen et al., 2008). In Cambodia treatment by boiling reduced by 98.5% (Brown & Sobsey 2012). High removal efficiency by boiling method could be due to heating water to a relatively high temperature (100°C), which has the potential to kill microorganisms in the heated water. Clasen et al. (2008) found out that heating drinking water to even 55°C has been shown to kill or inactivate most pathogenic bacteria, viruses and protozoa that are commonly waterborne.
Kazmi and Khan (2013) found out that heating water at 80°C kills pathogenic bacteria in water. Kazmi and Khan (2013) further noted that none of pathogenic bacteria including Escherichia coli were observed when water boiled up to 80°C Boiling as HWTS technology is advantageous in the sense that it is cheap to use and effective even in very turbid source water (Sobsey et al., 2002). Despite limitations, boiling is the most common form of HWTS in Uganda , used by 39.8% (Rosa & Clasen, 2010).
The biosand filtration method reduced total coliforms and Escherichia coli by 0.9 log10 (84.8%) and 1.2 log10 (100%) in the laboratory. The study found out microbial removal effectiveness of biosand filter did not significantly differ between source water samples; KMS2, RWA1 and KMS1 (Table 2). The present study partially supports Vanderzwaag et al. (2009), who reported that average log reductions were 1.7 (98%) for total coliforms and 1.4 (96%) for Escherichia coli. Stauber et al. (2011) reported that when analysis of biosand filters was restricted to samples that had higher Escherichia coli concentrations, removals greater than 99% were measured. Mahmood et al. (2011) found out that the mean Escherichia coli and total coliforms after biosand filtration was nearly 96% reductions. In addition, the findings of the current study do not support Baumgartner (2006) who found out that the average bacteria removal by biosand filtration method under laboratory conditions was 96.5%.
Stauber et al. (2006) found out that the geometric mean reductions of Escherichia coli by the biosand filter were 97% and 91% in laboratory experiments 1 and 2, respectively. In both experiments, the lowest Escherichia coli reductions were found during initial days of filter dosing. The minimum Escherichia coli reduction in experiment 1 was 1.2 log10 (93%) measured on day 4 and in experiment 2, it was 0.4 log10 (or 63%) measured on day 3. Maximum log10 reduction of Escherichia coli in experiment 1 and 2 were 2.0 log10 (99%) and 1.9 log10 (98.9%). Generally, total coliform and Escherichia coli removal efficiency by bios and filtration method might be due to the biological layer formed on the top of the filter. Tellen et al. (2010) report that after 65 days, average percentage reductions in total coliform, feacal coliform and fecal streptococci were 98.9% for traditional biosand filters and 99% for the improved biosand filters. The study further reported that both modifications showed statistically significant improvements.
Conclusion
Although none of the tested HWTS achieved complete removal (100%) of total coliforms, application of WaterGuard tablets was revealed to be the most efficient method in removing total coliforms from contaminated drinking water. Application of WaterGuard tablets, biosand filtration method and application of aqua safe achieved complete removal of Escherichia coli from source contaminated water samples. It is therefore important that the government and the concerned NGOs should provide training to improve local communities’ understanding to operate, maintain and appropriately use these household water treatment methods.
Acknowledgment:
I gratefully acknowledge the financial support from Germany Academic Exchange (DAAD). I would also like to express my sincere gratitude to the anonymous reviewers who made wonderful suggestions to shape this work.
Conflict of Interest:
The author declares no conflict of interest.
References
- 1. Albert, J., Luoto, J., Levine, D. End-user preferences for and performance of competing POU water treatment technologies among the rural poor of Kenya. (2010) Environ Sci Technol 44(12): 4426–4432.
- 2. Alekal, P.Y. Appropriate water treatment for the Nyanza Province of Kenya. (2005) Massachusetts Institute of Technology.
- 3. APHA. Standard Methods for the Examination of Water and Wastewater 15ed. (1981) American Public Health Association.
- 4. APHA. Standard methods for the examination of water and wastewater. (1995) Water Environment Federation, 19.
- 5. Baumgartner, J. The effect of user behavior on the performance of two household water filtration systems. (2006) Harvard School of Public Health..
- 6. Brown, J., Sobsey, M.D. Boiling as household water treatment in Cambodia: a longitudinal study of boiling practice and microbiological effectiveness. (2012) Am J Trop Med Hyg 87(3): 394–398.
- 7. Buzunis, B.J. Intermittently operated slow sand filtration: A new water treatment process. (1995) University of Calgary, Canada.
- 8. Clasen, T.F., Thao, D.H., Boisson, S., et al. Microbiological effectiveness and cost of boiling to disinfect drinking water in rural Vietnam. (2008) Environ Sci Technol 42(12): 4255–4260.
- 9. Crump, J.A., Otieno, P.O., Slutsker, L., et al. Household based treatment of drinking water with flocculant-disinfectant for preventing diarrhoea in areas with turbid source water in rural western Kenya: cluster randomized controlled trial. (2005) BMJ 331(7515): 478.
- 10. DWD. National Water Sewerage Corporation supply and distribution report. (2010) Government of Uganda.
- 11. Firth, J., Balraj, V., Muliyil, J., et al. Point-of-use interventions to decrease contamination of drinking water: a randomized, controlled pilot study on efficacy, effectiveness, and acceptability of closed containers, Moringa oleifera, and in-home chlorination in rural South India. (2010) Am J Trop Med Hyg 82(5): 759–765.
- 12. Kazmi, S.U., Khan, R.U. A Model to Study the Effect of Boiling on Water Borne Bacterial Diarrheal Agents. (2013) Can J App Sci 3(4): 491–495.
- 13. KDLG. Kabale District local government statistical abstract. (2012) Government of Uganda.
- 14. Kotlarz, N., Lantagne, D., Preston, K., et al. Turbidity and chlorine demand reduction using locally available physical water clarification mechanisms before household chlorination in developing countries. (2009) J Water Health 7(3): 497–506.
- 15. Levy, K., Anderson, L., Robb, K.A., et al. Household effectiveness vs. laboratory efficacy of point-of-use chlorination. (2014) Water Research 54: 69–77.
- 16. Mahmood, Q., Baig, S.A., Nawab, B., et al. Development of low cost household drinking water treatment system for the earthquake affected communities in Northern Pakistan. (2011) Desalination 273(2-3): 316–320.
- 17. Martin, A.H. The log reduction (LR) measure of disinfectant efficacy. (2010) Montana State University.
- 18. Mohamed, H., Brown, J., Njee, R.M., et al. Point-of-use chlorination of turbid water: results from a field study in Tanzania. (2015) J Water Health 13(2): 544–552.
- 19. Peletz, R., Mahin, T., Shaw, R., et al. Effectiveness of different household water treatment approaches for people living with HIV/AIDS in Africa. (2009) In Water, sanitation and hygiene: sustainable development and multisectoral approaches. Proceedings of the 34th WEDC International Conference, United Nations Conference Centre, Addis Ababa, Ethiopia. Water, Engineering and Development Centre (WEDC) Loughborough University of Technology. 604–608.
- 20. Rice, E.W., Bridgewater, L., APHA. Standard methods for the examination of water and wastewater. (2012) American Public Health Association Washington, DC.
- 21. Sobsey, M.D. Managing water in the home: accelerated health gains from improved water supply. (2002) World Health Organization, Geneva.
- 22. Sobsey, M.D., Stauber, C.E., Casanova, L.M., et al. Point of use household drinking water filtration: a practical, effective solution for providing sustained access to safe drinking water in the developing world. (2008) Environ Sci Technol 42(12): 4261–4267.
- 23. Stauber, C.E., Printy, E.R., McCarty, F.A., et al. Cluster randomized controlled trial of the plastic biosand water filter in Cambodia. (2011) Environ Sci Technol 46(2): 722–728.
- 24. Tellen, V., Nkeng, G., Dentel, S. Improved filtration technology for pathogen reduction in rural water supplies. (2010) Water 2(2): 285–306.
- 25. UBOS, ICF International. Uganda Demographic and Health Survey 2011. (2012) Kampala: Uganda Bureau of Statistics.
- 26. Vanderzwaag, J.C., Bartlett, K.H., Atwater, J.W., et al. Field evaluation of long-term performance and use of biosand filters in Posoltega, Nicaragua. (2009) Water Quality Research Journal of Canada 44(2): 111-121.
- 27. WE Federation, APHA, A.P.H. Standard methods for the examination of water and wastewater. (2005) American Public Health Association (APHA): Washington, DC, USA.
- 28. WHO, UNICEF. Progress on Sanitation and Drinking-water, 2010 Update. (2010) World Health Organization 60.
- 29. WHO, UNICEF. Progress on Drinking Water and Sanitation: 2014 Update. (2014) World Health Organization and UNICEF. Geneva, Switzerland.
- 30. WHO, UNICEF. WHO/UNICEF Joint Monitoring Programme for Water Supply and Sanitation. Estimates on the use of water sources and sanitation facilities. (2015).


