Hsp70 and Theta Subunit of T Complex Protein , a Response to Salt Stress in the Halophyte Sesuvium Portulacastrum
Akshaya Murugesan*1, Arun Kumar2, Anbarasi Gunasekar2, Indhumathi Arumugam2, Kaarunya Eswaran2, Balasubramanian Thangavel2, Somasundaram Thirugnanasambandan2
Affiliation
- 1Department of Biotechnology, Lady Doak College, Madurai, Tamilnadu, India
- 2Centre of Advanced Study in Marine Biology, Faculty of Marine Sciences, Annamalai University, Parangipettia, Tamilnadu, India
Corresponding Author
Akshaya Murugesan, Department of Biotechnology, Lady Doak College, Madurai, Tamilnadu, India. 625 001, Tel: +91 9698913977; E-mail: akshayamu@yahoo.com
Citation
Akshaya, M., et al. Hsp70 and Theta Subunit of T Complex Protein, a Response to Salt Stress in the Halophyte Sesuvium Portulacastrum. (2016) Bioinfo Proteom Img Anal 2(2): 116- 124.
Copy rights
© 2016 Akshaya, M. This is an Open access article distributed under the terms of Creative Commons Attribution 4.0 International License.
Keywords
Halophyte; Salt stress; Sesuvium portulacastrum; 2D electrophoresis; Mass spectrometry
Abstract
The proteomic analysis was performed to explore the salt responsive proteins in S. portulacastrum a salt marsh euhalophyte. Protein profile showed profound differences in the expression pattern of salt treated plant. The total protein content was significantly high in leaf than in shoot and root. 2D electrophoresis revealed that 7 proteins were down regulated, 6 proteins were up-regulated and 46 proteins were newly expressed in S.portulacastrum leaves. Two spots from newly expressed proteins were randomly selected and characterized by MALDI-TOF/MS analysis. Protein mass fingerprinting annotation showed different peptide intensities and subsequent sequence homology search using MASCOT software categorized those proteins as Hsp70 and theta subunit of T complex protein with pI/kDa, 5.2/70kDa and 4.9/53kDa respectively. Hsp70 has been proposed as biomarker for stress produced by NaCl which emphasize its role in protecting plants against stress, whereas theta subunit of T complex protein seems to have role during protein folding expressed during abiotic stress, which yet to be characterized. The resulting findings addressed the significance of stress related proteins on the survival of plants in extreme conditions and it can be complemented with large scale studies on functional and molecular interaction of proteins expressed during saline stress.
Introduction
The beginning of 21st century is marked by scarcity of drinking water resources, due to environmental pollution and increased salinization of soil and water. Almost 71% of the earth’s area is occupied by saline water. Abiotic stress is a major limiting factor in plant growth. Among the various abiotic stresses to which plants are constantly exposed, salt stress is one of the most important factor that affects growth and productivity of plants[1,2]. The plants naturally adapted to high soil salinity are known as halophytes. Their physiological process of adaptation is well developed compared to glycophytes. Salt stress adaptation in plants occurs through an organized physiological process at both cellular and molecular levels such as ion homeostasis, osmotic adjustments, ion extrusion and compartmentalization[3,4]. The Plant stress adaptive responses include dynamic transcriptome changes, presumably playing important role in co-ordination of the many different molecular events responsible for cellular homeostasis. Various genome wide analyses such as microarray, genetic and physical mapping of chromosomes, helps in identification of salt stress responsive genes. While transcriptomic approaches are important, determination of gene function requires the identification of encoded proteins by current proteomic approaches[5]. 2D electrophoresis has been successfully applied for examination of induced gene products in several plant species subjected to a wide range of abiotic treatments, including salt[6], drought[7], temperature[8], ultraviolet radiation[9], heavy metals[10] and herbicides[11]. The proteomics of various plants in response to salinity have been studied[12-18], however, to date, the proteome analysis in halophytes is limited. Sesuvium portulacastrum belongs to the family Aizoaceae, commonly known as ‘shoreline purslane’. It is a sprawling perennial herb that grows in coastal areas throughout the world. It mainly inhabits sandy clay, coastal limestone, and salt marshes. It is also known for its medicinal value such as antibacterial, anticandidal and moderate antifungal activity[19]. But the paucity of the information about the molecular regulation of salt tolerance mechanisms of S. portulacastrum persuades to choose it as a representative species for further investigation. Plant salt tolerance is controlled by complex and sophisticated molecular networks of signaling pathways. It displays common as well as specific characteristics in different species of halophytes. In the present study, S. portulacastrum was exposed to different salinities (0 mM, 100 mM, 200 mM, 300 mM, 400 mM and 500 mM NaCl) in a time course study which revealed various morphological variations and changes at protein level. Further characterization of protein of interest is done via MALDI-TOF mass spectro-photometry which explains the importance on the functions of the salt responsive protein. Our results lay a solid foundation necessary for further investigation on the salt tolerance networks.
Materials and Methods
Effect of salinity on germination of seeds
Seeds of wild type S. portulacastrum used in this study were collected from Vellar estuary (Lat. 11° 29′N and Long.79° 49′E) near Parangipettai in the southeast coast of India. Prior to germination, seeds were shade dried and hand sieved. Seeds of S. portulacastrum were immersed thoroughly in 70% (v/v) ethanol for 5 min, sterilized by 0.1% mercuric chloride and washed with sterile distilled water. Seeds were stored in 100 ml of distilled water at 27°C for 24 h. Replica of 100 seeds per 90 mm petri dishes were germinated on filter paper wetted with 3 ml of sterile ½ MS (Murashige and Skoog media, pH 5.8), and kept in culture chamber initially at 27°C for 72 h darkness followed by 16 h of photoperiod. After radical development from the seed (usually after 6 days) 3 ml of ½ MS media was added to control plate, with the increasing concentration of NaCl (100 mM, 200 mM, 300 mM, 400 mM and 500 mM NaCl) in their respective plates.
Germination test
Germination (emergence of radicle) was recorded every day after start of the salt treatment[20]. The rate of germination was calculated using GP: Ni / N × 100, where, Ni: number of germinated seed/ treatment days, N: total number of seeds. Samples were harvested after 16 days of germination and immediately stored at -80°C until use.
Plant material and saline treatment
The seeds were germinated and grown in a soil mixture containing shore sand and vermiculated manure in a 1:1 ratio in small germination plastic pots. Plants cultivated in soil were watered every day and supplemented on alternate days with a ½ MS media. Six week old plantlets were carefully transferred to hydroponic conditions and maintained in a culture room with a dark/light cycle of 8/16 h at 37°C for two weeks. Further the plants were exposed to three different concentrations of NaCl (300 mM, 0.5 M & 1 M) and subjected to time course study. Nutrient solution was replaced every day in order to avoid depletion of nutrients. Upon completion of the treatments, leaves shoot and root tissues were separately collected, frozen in liquid nitrogen at −80°C and used for various proteomic analysis.
Total Protein extraction and estimation
Total protein was extracted by phenolic method using BPP (borax/ phenol/polyvinylpyrolidine)[21] 1 g of frozen leaf tissue from S. portulacastrum was powdered and resuspended in 3 mL of ice-cold extraction buffer containing 100 mM Tris (pH 8.0), 100 mM EDTA, 50 mM borax, 50 mM vitamin C,1% PVPP w/v, 1% Triton X-100 v/v, 2% β-mercaptoethanol v/v , 30% sucrose w/v and vortexed for 5 min at room temperature. Two volumes of tris saturated phenol (pH 8.0) were added and further vortexed for 10 min. The sample was centrifuged (Beckmann Coulter ultracentrifuge, India) at 4°C for 15 min at 15, 000 g and the upper phase was transferred to a new centrifuge tube. Equal volume of extraction buffer was added to the mixture, vortexed for 10 min, followed by centrifugation to the above mentioned condition. Proteins from the supernatant were precipitated by adding five volumes of ammonium acetate saturated-methanol, and incubated at -20°C for at least 6 h. After centrifugation as described above, the protein pellet was re-suspended and rinsed twice with ice-cold methanol followed by ice-cold acetone at 15,000 g for 5 min. at 4°C. Finally, the washed pellet was air-dried, recovered with lysis buffer (9 M urea, 2% CHAPS, 13 mM DTT, 1% IPG buffer) and stored at -80°C for further studies.
Dialysis and clean – up of protein samples: Dialysis of the protein samples was done in 50 μm thick membrane (Himedia) against dialysis buffer containing 20 mM Tris-Cl, 100 mM NaCl and 3 mM DTT (pH8.0) with change of buffer system thrice for an interval of 4 hours in cold room. After dialysis, the sample was carefully transferred to a pre-sterilized 2ml tube and further processed with clean– up kit (Bio-Rad) following the instructions given in the manual.
Quantification of Proteins: Protein concentration was determined for leaf, shoot and root of S. portulacastrum by bicinchoninic acid protein assay kit (BCA, Sigma Aldrich) following the manufacturer’s manual using the LAMBDA 25 UV/Vis Spectrophotometer (Perkin Elmer). BSA was used as the standard and the absorbance was measured at 562 nm.
Protein profiling through SDS-PAGE: Proteins were resolved in SDS–Polyacrylamide gel[22] as described by Ausubel, F., et al[23]. Routinely Aliquots of protein samples of equal concentration were analyzed. The precipitated proteins were recovered by centrifugation in a microfuge for 10 min. The supernatant was carefully aspirated and the pellet was dissolved in 15 μL of 0.1N NaOH and 5 μL of 4X sample buffer. The samples were heated to 80°C for 15 min, and electrophoresis was performed with a constant current of 150 volt.
Protein Separation via isoelectric focussing
One dimensional electrophoresis: An IEF-tube gel of 7 cm, with broad range pH 3.0 – 10.0) was used (Bio-Rad, USA). The strip was loaded with 100 μg of protein dissolved in 125 μL of rehydration buffer and incubated overnight for efficient rehydration. Strips are subjected to isoelectric focussing at 250 V for 20 min, 4000 V for 2 h and 4000 V/10,000 V/hr at 20°C.
Two dimensional electrophoresis: The strips were equilibrated with equilibration buffer I (50 mM Tris pH8.8, 30% glycerol, 2% SDS, 0.002% bromophenol blue) containing 1% DTT, and subsequently with 4% iodoacetamide for 15 min with equilibration buffer II separation of proteins in the second dimension was performed using 10% SDS Polyacrylamide gels. The gels were stained with coomassie brilliant blue (CBB) and the positions of individual proteins on gels were evaluated robotically with PDQuest software (Bio-Rad). The pI and Mr of each protein was determined using 2D-PAGE markers.
Image acquisition and data analysis: Spot detection, spot measurement, background subtraction and spot matching were performed specifically after CBB staining of the gels using PDQuest software. Following automatic spot detection, gel images were carefully edited. Before spot matching, one of the gel images was selected as the control gel. The resulting data from image analysis were transferred to PDQuest software for querying protein spots, which show quantitative or qualitative variations. The apparent Mr of each protein in gel was determined by referencing to the protein markers.
Protein identification via mass spectrometry: Proteins were characterized according to a method described by Shen, S., et al[24]. Briefly, individual protein spot was excised from the gel, and de-stained twice with 50% acetonitrile (ACN), 50 mM NH4HCO3 at 37°C for 30 min, dehydrated by adding 10 μL ACN, and dried. The proteins in the gel slices were reduced with 10 mM DTT in 100 mM NH4HCO3 for 1 h, and incubated in the solution containing 40 mM iodoacetamide and 100 mM NH4HCO3 for 30 min at room temperature. Each gel slice was minced, lyophilized, and rehydrated in 100 mM NH4HCO3 containing 5 pmol trypsin (trypsin, modified, sequencing grade, Roche Applied Science, Penzberg, Germany) overnight at 37°C. Tryptic peptides were extracted two times with 20 μL 50% ACN, 0.1% formic acid (FA) for 30 min at 37°C, and 10 μL ACN for 30 min at room temperature. After each extraction, samples were centrifuged at 1000 g for 30 s, and all supernatants were combined, vacuum-dried, and stored at -80°C until MS analysis. Matrix was prepared by dissolving α-cyano-4-hydroxycinnamic acid in 50% ACN and 0.1% TFA. 10 μL of matrix solutions were added into the dried digests and the mixture was vortexed for 30 min. One micro liter was spotted initially on an Anchor chip target plate (384F, Bruker Daltonics), followed by 7 μL of matrix solution. The dried sample on the target plate was washed with 1 mL of 0.1% TFA twice, left for 30 s before solvent removal, and dried for MALDI-TOF/MS/MS analysis. Mass spectra were obtained on an Autoflex MALDI-TOF mass spectrometer (Bruker-Daltonics, Billerica, MA, USA) equipped with a pulsed N2 laser (337 nm). Then the spectrum was analyzed with flex-Analysis software (Version 3.2) and homology search was performed against non-redundant NCBI (NCBInr) database using MASCOT software Version 2.2. Best matches were selected with the Mascot score higher than 71 (threshold level). To avoid false positives, an additional in-house BLAST search at NCBI https:// blast.ncbi.nlm.nih.gov/Blast.cgiwas done to confirm all the matches.
Database searching with MS/MS spectra: MS/MS spectra were used to search against the NCBI non-redundant protein database using MS/MS Ion Search Engine, a computer software program conducting protein identification based on matching the MS/MS spectra of a protein with a protein or DNA sequence data base, MASCOT: https://www.matrixsci nce.com/help/scoring_help.html. A single protein having a higher score than the minimum score for the significance level (p < 0.05) was judged as a significant match.
In each MASCOT search output result, the minimum score for significance level was provided, based on the absolute probability and the size of the sequence database being searched. Protein sequence with the significant homologues was retrieved from NCBI database. The consensus pattern within the homologous was detected by performing multiple sequence alignment using CLC sequence viewer version 6.0. The presence of the conserved motifs was detected using conserved domain database and ScanProsite.
Results and Discussion
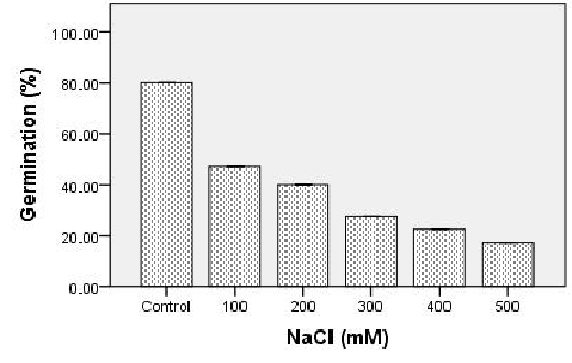
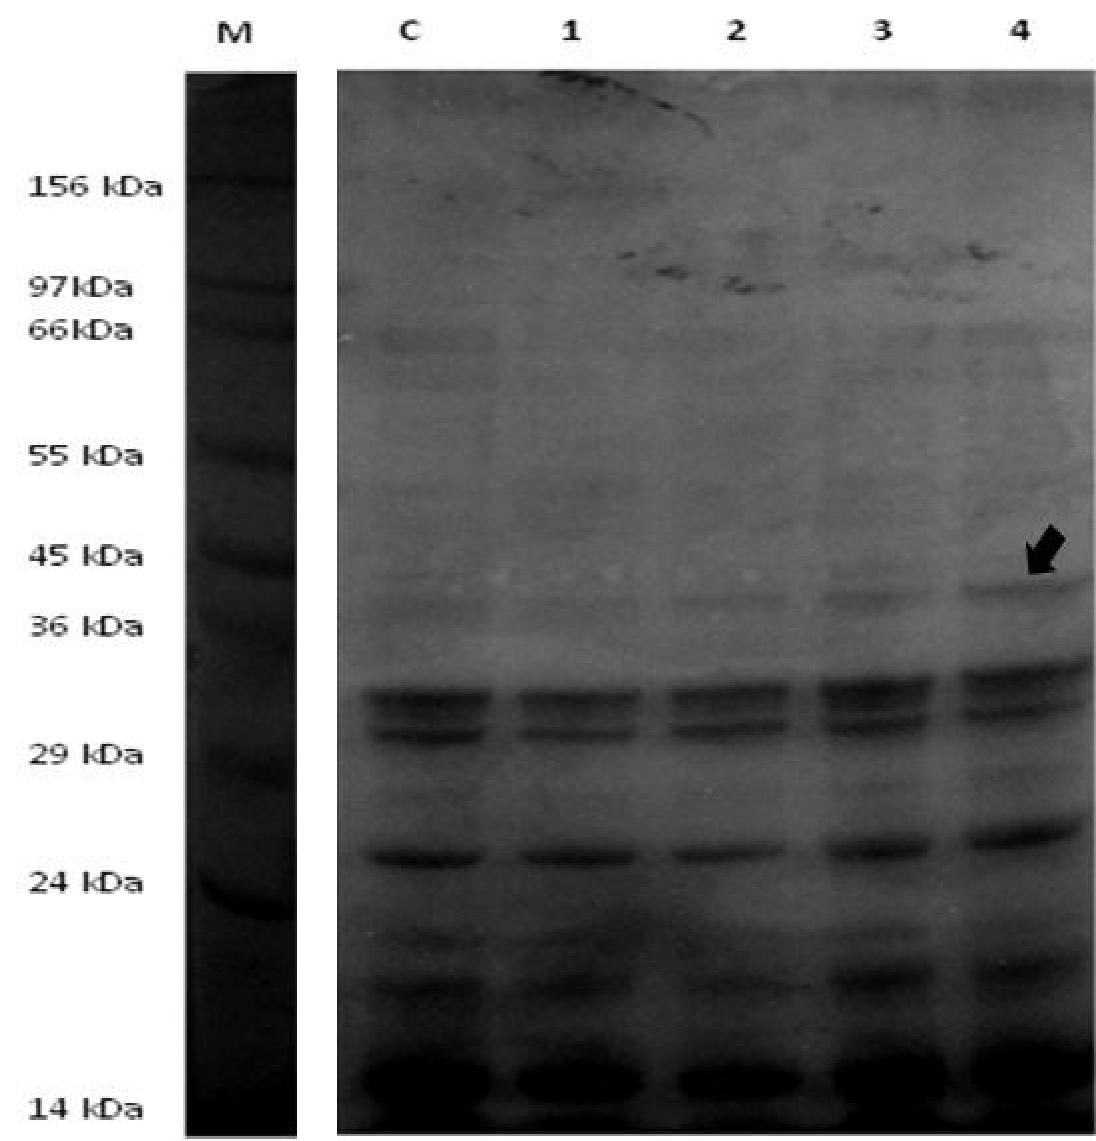
Effect of salinity on seed germination of S. portulacastrum: The germination percentage of halophyte was strongly affected by higher salt concentration (500 mM). At the sixteenth day after sowing, the final germination percentage for each of the different concentration of NaCl was calculated. Germination was found to be 80% in control plant after 3 days of sowing (without NaCl treatment), better at 100 mM, 200 mM NaCl and found to have significant reduction at 300 mM with the least germination percentage as the concentration of salinity increases. Increasing salinity caused delay and a gradual decrease in germination [Figure.1 (A)]. As discussed by Khajeh-Hosseini, M., et al[25], high salinity leads to reduced osmotic potential which prevents the water uptake necessary for the mobilization of the nutrient required for germination. It can also be due to the toxic effects of Na+ and Cl- ions on the germination process. Expression of protein at ~ 40kDa was found to be prominently up-regulated as the concentration of salt increases [Figure.1 (B)]. Further 2-Dimensional electrophoresis analysis was performed to quantitative the differential protein expression of seeds under salt stress.
Figure 1(A): Seeds were germinated in petri dishes on filter paper wetted with ½ MS media. The values shown are the means of germination percentage determined at different concentration of NaCl for replicates with 100 seeds per treatment.
Figure 1(B): Profiling of seed protein from S. portulacastrum by SDS-PAGE showed differential expression after treatment with varying concentration of NaCl. Lane M: protein marker; lane C: control seed maintained in ½ MS media; lane 1-4: increasing concentration of NaCl (100 mM, 200 mM, 300 mM and 400 mM) harvested after 16 days. All lanes were loaded with 20 μg protein. An arrow indicates the up-regulation of protein ~40 kDa after NaCl treatment.
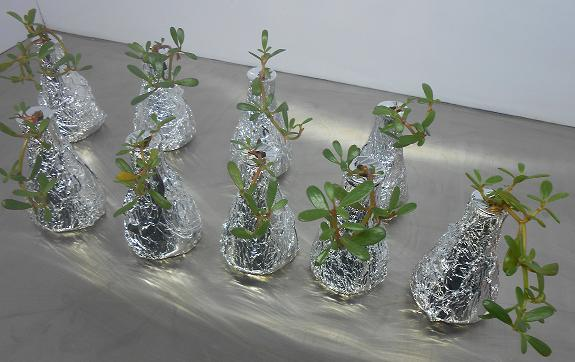
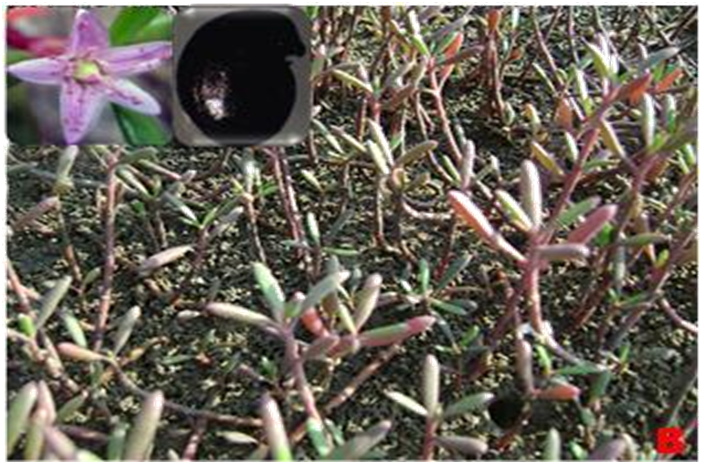
Effect of salinity on plant growth: The seeds of S. portulacastrum collected from mangrove associated Vellar estuary [Figure. 2(A)] with the water salinity 26 ppt, was grown in appropriate and controlled environmental conditions in green house. During acclimatization [Figure 2 (B)], the waxy coat of the S. portulacastrum was reduced due to the sudden change in growth condition, which takes at least 4 days for its gradual recovery. Plants that are treated with NaCl above their threshold levels such as 400 mM and 500 mM for 1, 2 and 3 days, developed several stress related morphological phenotypes in leaves such as thickening of the leaves and cuticular wax depositions. Similar experiments were conducted in maize by Cramer, G.R., et al[26], where there is rapid and transient reduction in the rate of leaf expansion after sudden increase in salinity. This might be due to changed water relationship and not the presence of Na+ and Cl-[27].
Figure 2A: Plant acclimatized in ½ MS media in culture room for proteomic analysis.
Figure 2B: Halophyte, seeds of Sesuvium portulacastrum from the collection area were transported carefully
Effect of salinity on protein content of S. portulacastrum: Protein isolated from different tissues of S. portulacastrum such as leaves, shoot and root on varying saline treatment showed significant difference in the protein content [Figure.3]. The consistent reason is due to the abundance in the presence of Rubisco (ribulose-1, 5-bisphosphate carboxylase/oxygenase) in leaf tissues makes the proteins facile to be isolated by the BPP method[28].
Figure 3: Effect of salinity on the protein content of different tissues of S. portulacastrum at different time point. The values shown are the means of (± S.D.) of triplicate S. portulacastrum plants treated with 300 mM NaCl.
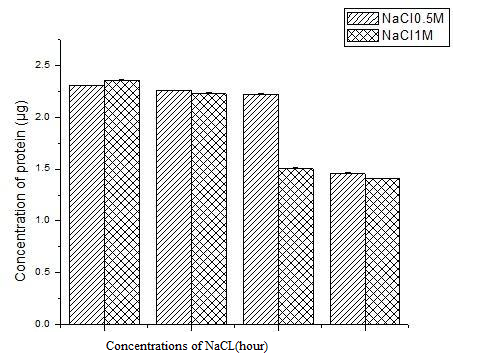
Leaf protein profiling of S. portulacastrum on NaCl treatment: Effect of salinity in the level of protein expressed in the leaves of S. portulacastrum was identified by performing two different sets of treatments with NaCl. First set of plants was treated with threshold concentrations of NaCl (300 mM) which is determined through seed germination percentage, for different time periods (4, 8, 12, 16, 20, 24, 48 and 72 h). Second set of plants was treated with higher concentration of NaCl (0.5 & 1 M) for 3, 6 and 9 h in order to study the time dependent changes in the expression of protein. Recognition of the importance of time frame led to the concept of two phase growth response to salinity[29]. This is an important criterion when screening for the salt tolerant plants. First phase of growth reduction is apparently due to the osmotic or water stress in which there is surprisingly little genotypic variations. Second phase of growth reduction which takes time to develop which results from salt accumulating in transpiring leaves to excessive levels. This exceeds the ability of the cells to compartmentalize the salts in the vacuoles, finally leading injury to the cells[30]. SDS-PAGE analysis was performed and the protein profile was outlined. On 10% SDS-PAGE gel, distinct protein bands were observed with varying expression levels and molecular weight. Plants treated with 300 mM NaCl showed differential expression of protein at ~54 kDa and ~15 kDa which is analyzed through alpha-imager against standard protein marker [Figure 4]. Similarly, protein extracted from the leaf of S. portulacastrum for higher concentration of NaCl showed changes in the expression of protein in abundance when compared with non- stressed control plants at 0 hour. Maximum expression was observed in 0.5 and 1 M (3 h) treatment with NaCl. As the treatment time is increased, the expression of protein at ~54 kDa & ~15 kDa [Figure 5,6] showed significant reduction, which might be due to high level of salt that makes the plant less compatible to survive in such stressful condition.
Figure 4: Protein profiling of leaf protein from Sesuvium portulacastrum 10% SDS-PAGE showed differential expression after treatment with threshold concentration of NaCl (300 mM); lane M: protein marker; lane 1-7: 300 mM salt treatment in ½ MS media at different time intervals (4hr - 72 h); lane 8 -10: direct salt treatment (300 mM Nacl) for 4h to 12 h; lane C1: control plant grown in ½ MS media; lane C2: control plant grown in vermiculated soil. All lanes were loaded with 20 μg protein. Arrows indicates the increased and decreased polypeptide expression between treated and normal plants.
Figure 5: The values shown are the means of (± S.D.) of triplicate S. portulacastrum plants treated with 0.5 M and 1 M NaCl.
Figure 6: Leaf protein profile on time dependent changes in leaves of S. portulacastrum in 10% SDS-PAGE. lane M: protein marker; lane C1: control plant grown in ½ MS media; lane C2: control plant grown in vermiculated soil; lane 1,3,5: 0.5 M treat ment at different time point (3 hr, 6 hr, 9 hr) and lane 2,4,6 : 1 M NaCl treatment at different time point (3 h,6 h,9 h).
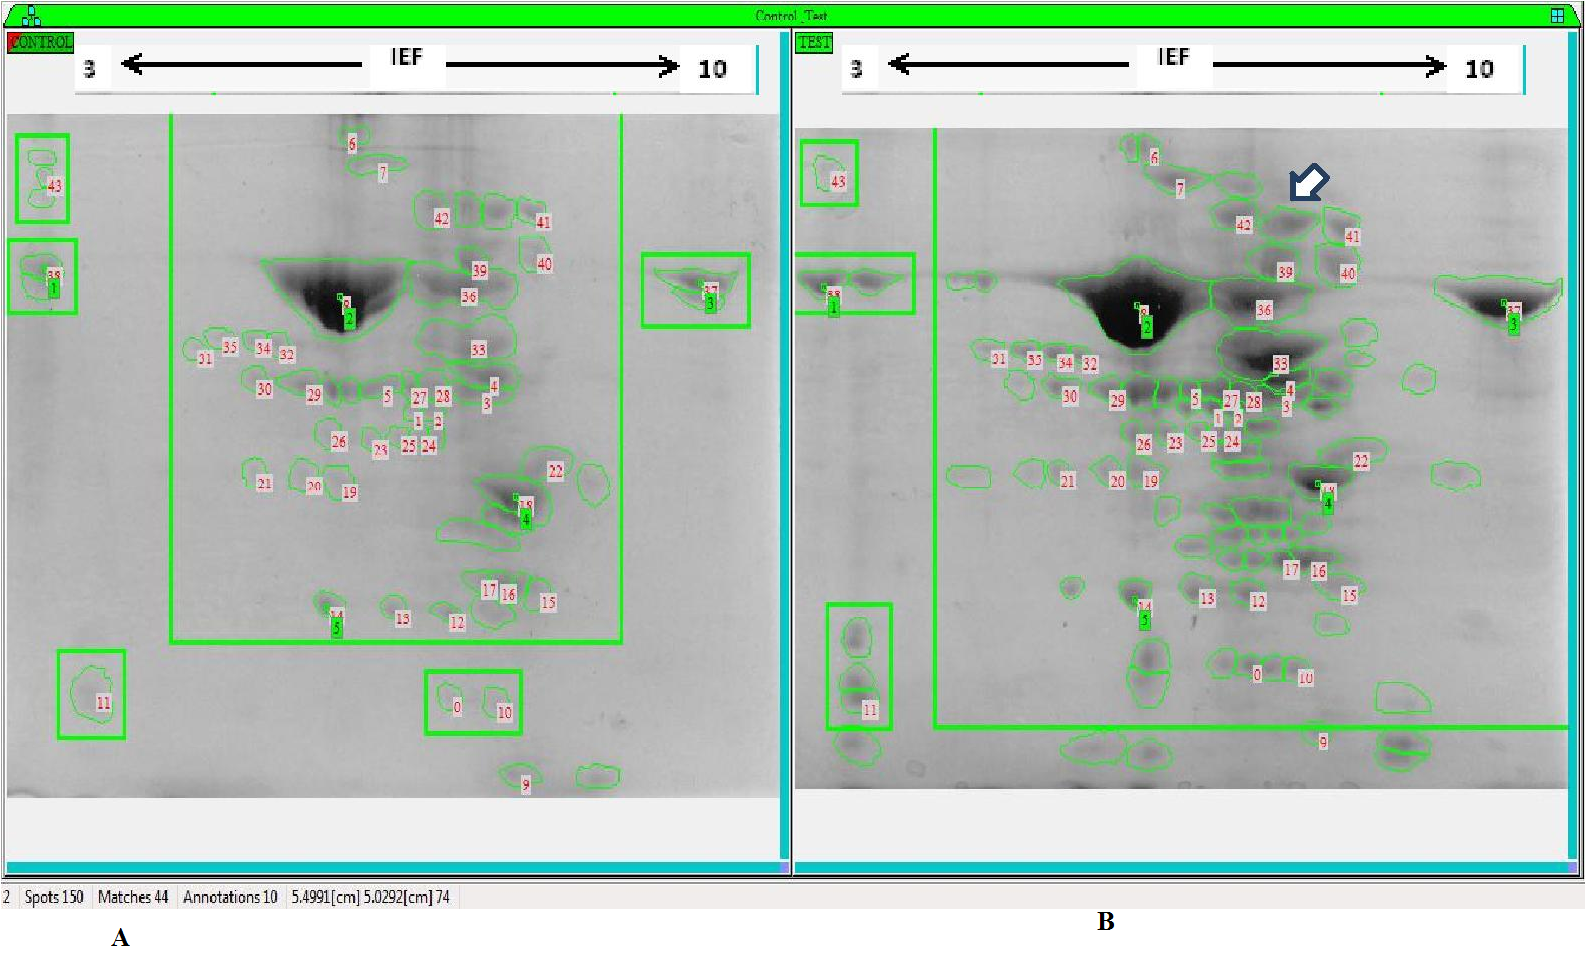
Two-dimensional gel electrophoresis (2-DE) of S. portulacastrum leaf protein: Six week old plants were treated with 300 mM NaCl for different time periods. The Cl- content in salt treated halophytes is regulated differently roots and in leaves with minimum and maximum accumulations respectively[31]. Since morphological and physiological differences are prominent in leaves that may play important roles in salt tolerance, we performed proteome analysis in leaves from salt-treated S.portulacastrum. Total proteins were extracted after 0 h and 24 h treatment with threshold level of NaCl (300 mM). Proteins were then separated by 2-DE, and those proteins spots showing reproducible changes were selected and their expression patterns were analyzed. 2D-PAGE analysis from proteins extracted from leaves, revealed the differential expression of 59 protein spots which showed significant difference in their abundance between control and treated samples [Figure. 7 A & B)]. Among the 59 spots, 46 were newly expressed on salt stress, 6 were up regulated and 7 were down regulated (Table 1). Most distinct two different newly expressed protein spots were selected and further functional characterization was performed through MALDI-TOF/MS.
Figure 7(A & B): 2-DE of leaf protein profile of S. portulacastrum A) Control plant grown in ½ MS media B) Plant treated with 300 mM NaCl (24 h) and proteins from leaves were extracted and separated by 2-DE. Duplicates were performed for each sample. Differentially expressed protein spots were numerically marked and the number of expressed proteins was represented in Table1. The arrows indicate the protein spots subjected for MS identification.
Table 1: Differentially expressed proteins from leaves of S. portulacastrum on treatment with 300 mM NaCl.
| Leaves of S. portulacastrum | differentially expressed proteins under salt treatment | Match between control and treated plants | ||
| Up regulated Down regulated newly expressed | ||||
| 6 | 7 | 46 | 44 | |
Of a total of 150 differentially accumulated protein spots, only 44 spots were consistent from which 2 newly expressed protein spots were selected for MALDI-TOF analysis.
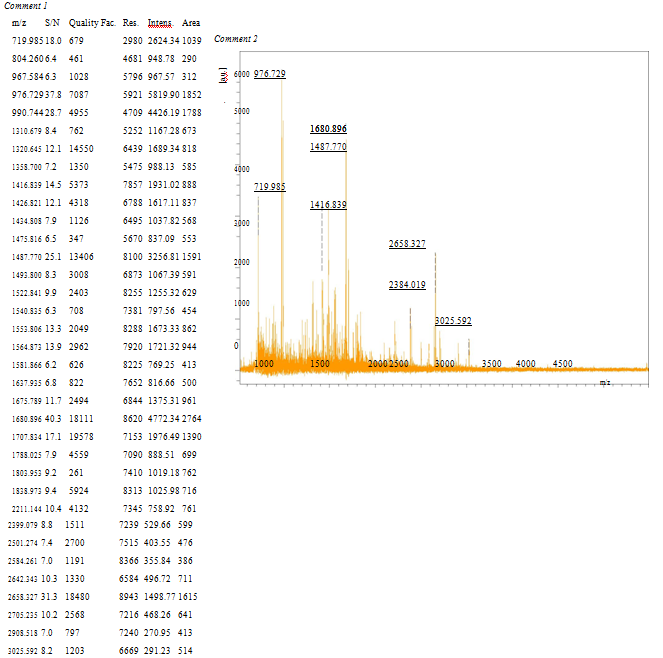
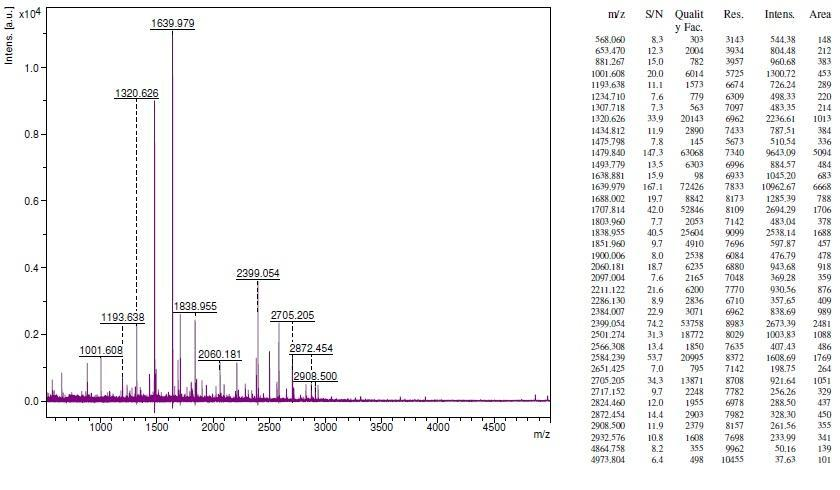
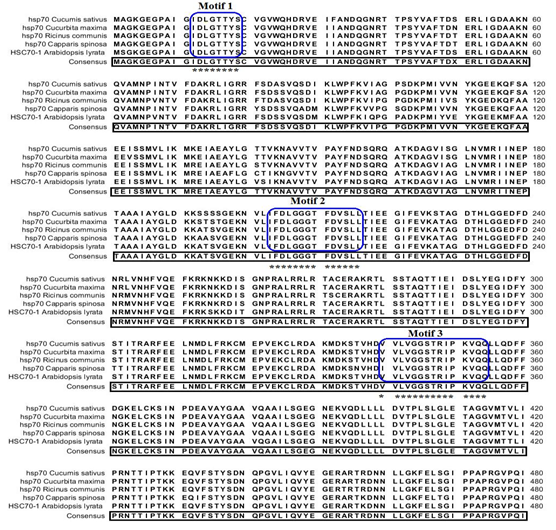
Identification of salt responsive proteins from S. portulacastrum: Analysis of protein mass fingerprinting data (PMF) of two proteins (spot 1 & spot 2) derived by MS analysis using MASCOT search algorithm showed homology to heat shock protein 70 (Hsp70) from Cucumis sativus and theta subunit of T-complex protein from Coccomyxa subellipsoidea C-169. The analysis showed that the protein spot 1 [Figure. 8 (A)] functions as chaperones for newly synthesized proteins to prevent their accumulations as aggregates and folds in a proper way during their transfer to their final location[32]. The expression of Hsp70 genes correlates positively with the acquisition of thermo-tolerance[33] and results in enhanced tolerance to salt, water and high temperature stress in plants[34] and for this reason Hsp70 has been proposed as potential biomarker[35]. Prokaryotic and eukaryotic organisms respond to heat shock or other environmental stress by the induction of the synthesis of proteins collectively known as heat-shock proteins (Hsp). Hsp70 is a multifunctional protein that plays an important role in the transport of protein across membranes, in protein folding and in the assembly/ disassembly of protein complexes can direct incompetent “client” proteins towards degradation. Protein spot 2 [Figure 8 (B)] also functions as molecular chaperons that assist in folding of proteins upon ATP hydrolysis in protecting plant cell from the detrimental effects of stress. Until now, there is not much data available on the functional specificity of theta protein on salt stress. Sequence analysis for protein spot 1, hsp70 with its significant homologues from MALDI-/TOF/MS was performed. Since the S. portulacastrum genome sequences are not known, a homology based search was performed. Multiple sequence alignment with their respective homologues revealed 98% consensus pattern. Functional annotation was done using Scan prosite revealed the presence of three hsp70 protein signature pattern [Figure 9], of which penta-petptide conserved signature is present in N terminal region and the other two motifs is conserved in the central part of the sequence. Similarly, the protein spot 2 which is the theta subunit of T complex protein showed least significant among the homologues obtained via MALDI-/TOF/MS.
Figure 8(A): Identification of proteins from S. portulacastrum via MALDI TOF/MS. The protein spot 1 was excised and digested with trypsin and then collected peptide was analyzed using MALDI/TOF/ mass spectrometer. The annotated PMF spectral peaks showed the intensities of different peptide (A for spot 1). Database searching with Mascot software against NCBInr database identified the protein as Hsp70.
Figure 8(B): Identification of proteins from S. portulacastrum via MALDI TOF/MS. The protein spot 2 was excised and digested with trypsin and then collected peptide was analyzed using MALDI/TOF/ mass spectrometer. The annotated PMF spectral peaks showed the intensities of different peptide (B for spot 2). Database searching with Mascot software against NCBInr database identified the protein as T complex protein.
Figure 9: Comparison of deduced amino acid sequence with the homologues of Hsp70 obtained from Mascot software for Sesuvium portulacastrum. Sequences were aligned using the CLC sequence viewer program. Gaps have been introduced to least level to optimize the alignment. Consensus amino acids are highlighted in black boxes. All three conserved Hsp70 protein family motif are given in astrix. The sources of the proteins and gene bank accession numbers are as follows, Cucumis sativus (gi|6911551), Ricinus communis (gi|255575054), Vigna radiate (gi|45331283), Gossypium hirsutum (gi|211906496) and Arabidopsis lyrata subsp. lyrata (gi|297810345).
Conclusion
Plants have advantage of studying the biological responses to environmental factors as they are easily handled and also they have enormous breadth of genetic diversity at interspecific and intraspecific. Comprehensive dynamic protein profiling analysis and characterization of regulatory mechanisms are now essential to understand the plant physiology such as their adaptation and interaction with the environment. Identification of Hsp70 and theta subunit of T complex protein clearly showed the importance of such proteins during salt stress. The response of plants to stress through proteomic approach is under infancy stage and is becoming an active and evolving field with large impact on plant biology. There are various factors to be considered and addressed to develop plants salt tolerance, which may lead to application in breeding for enhanced tolerance in crop plants.
Acknowledge:
This work was supported by grants received under Centre of Excellence and programme support in areas of Biotechnology, Department of Biotechnology, Government of India, New Delhi. Thanks to the technical support by DBT, India vide project reference “BT/PR 10211/ BCE/08/615/2007”, DBT-BIF, Lady Doak College, Madurai, Tamilnadu, India.
Conflict of interest:
No Conflict of Interest.
References
- 1. Vaidyanathan, S., Broadhurst, D.I., Kell, D.B., et al. Explanatory optimization of protein mass spectrometry via genetic search. (2003) Anal Chem 75(23): 6679-6686.
- 2. Veeranagamallaiah, G., Chandraobulreddy, P., Jyothsnakumari, G., et al. Glutamine synthetase expression and pyrroline-5-carboxylate reductase activity influence proline accumulation in two cultivars of foxtail millet (Setaria italic L.) with differential salt sensitivity. (2007) Environ Exp Bot 60(2): 239-244.
- 3. Baisakh, N., Subudhi, P.K., Varadwaj, P. Primary responses to salt stress in a halophyte smooth cord grass (SpartinaalternifloraLoisel.). (2008) Funct Integr Genomics 8(3): 287-300.
- 4. Zhu, J.K. Genetic analysis of plant salt tolerance using Arabidopsis. (2000) Plant Physiol124 (3): 941-948.
- 5. Parker, R., Flowers, T.J., Moore, A.L., et al. An accurate and reproducible method for proteome profiling of the effects of salt stress in the rice leaf lamina. (2006) J Exp Bot 57(5): 1109- 1118.
- 6. Srivastava, S., Fristensky, B., Kav, N.V.K. Constitutive Expression of a PR10 Protein Enhances the Germination of Brassica napusunder Saline Conditions. (2004) Plant Cell Physiol 45(9): 1320–1324.
- 7. Vincent, D., Lapierre, C., Pollet, B., et al. Water deficits affect caffeate O-methyltransferase, lignifications, and related enzymes in maize leaves. A proteomic investigation. (2005) Plant Physiol137 (3): 949-960.
- 8. Sule, A., Vanrobaeys, F., Hajos, G., et al. Proteomic analysis of small heat shock protein isoforms in barley shoots. (2004) Phytochemistry 65(12): 1853-1863.
- 9. Rakwal, R., Agrawal, G.K., Yonekura, M. Separation of proteins from stressed rice (Oryzasativa L.) leaf tissues by two-dimensional Polyacrylamide gel electrophoresis: induction of pathogenesis-related and cellular protectant proteins by jasmonic acid, UV irradiation and copper chloride. (1999) Electrophoresis 20(17): 3472–3478.
- 10. Hajduch, M., Randeep, R., Ganesh, K.A., et al. A High-resolution two-dimensional electrophoresis separation of proteins from metal-stressed rice (Oryzasativa L.) leaves: drastic reductions/fragmentation of ribulose-1, 5-bisphosphate carboxylase/oxygenase and induction of stress related proteins. (2001) Electrophoresis 22(13): 2824-2831.
- 11. Castro, A.J., Carapito, C., Zorn, N., et al. Proteomic analysis of grapevine (Vitisvinifera L.) tissues subjected to herbicide stress. (2005) J Exp Bot 56(421): 2783-2795.
- 12. Lee, S., Lee, E.J., Yang, E.J., et al. Proteomic identification of annexins, calcium-dependent membrane binding proteins that mediate osmotic stress and abscise acid signal transduction in Arabidopsis. (2004) Plant Cell 16(6): 1378-1391.
- 13. Abbasi, F.M., Komatsu. A proteomic approach to analyze salt-responsive proteins in rice leaf sheath. (2004) Proteomics 4(7): 2072-2081.
- 14. Kim, D.W., Rakwal, R., Agrawal, G.K., et al. A hydroponic rice seedling culture model system for investigating proteome of salt stress in rice leaf. (2005) Electrophoresis 26(23): 4521-4539.
- 15. Yan, S., Tang, Z., Su, W., et al. Proteomic analysis of salt stress-responsive proteins in rice root. (2005) Proteomics 5(1): 235-244.
- 16. Jiang, H.E., Li, X., Ferguson, D.K., et al. The discovery of Capparisspinosa L. (Capparidaceae) in the Yanghai Tombs (2800 years BP), NW China, and its medicinal implications. (2007) J Ethno pharmacol 113(3): 409-420.
- 17. Nohzadeh Malakshah, S., Habibi Rezaei, M., Heidari, M., et al. Proteomics reveals new salt responsive proteins associated with rice plasma membrane. (2007) Biosci Biotechnol Biochem 71(9): 2144-2154.
- 18. Vincent, D., Ergül, A., Bohlman, M.C., et al. Proteomic analysis reveals differences between Vitis vinifera L. cv. Chardonnay and cv. Cabernet Sauvignon and their responses to water deficit and salinity. (2007) J m Exp 58(7): 1873-1892.
- 19. Chandrasekaran, M., Senthil kumar, A., Venkatesalu, V. Antibacterial and antifungal efficacy of fatty acid methyl esters from the leaves of SesuviumportulacastrumL. (2011) European Review for Medical and Pharmacological Sciences 15(7): 775-780.
- 20. Mohammad Hosein Bijeh Keshavarzi. Effect of Salt Stress on Germination and Early seedling Growth of Savory (Satureja hortensis). (2011) Aust J Basic & Appl Sci 5(12): 3274-3279.
- 21. Wang. X., Duan. S., Geng. B., et al. A missing link to angiosperms? (2007) BMC Evol Biol 7: 14.
- 22. Laemmli, U.K. Cleavage of Structural Proteins during the Assembly of the Head of a Bacteriophage T4. (1970) Nature 227(5259): 680-685.
- 23. Ausubel, F., Brent, R., Kingston, R., et al. Current Protocolsin Molecular Biology (1989) Wiley-Liss, Inc 1(2): 148.
- 24. Shen, S., Jing, Y., Kuang, T. Proteomics approach to identify wound-response related proteins from rice leaf sheath. (2003) Proteomics 3(4): 527-535.
- 25. Khajeh-Hosseini, M., Powell, A.A., Bingham, I.J. The interaction between salinity stress and seed vigour during germination of soybean seeds. (2003) Seed Sci Technol 31(11): 715-725.
- 26. Cramer, G.R., Bowman, D.C. Kinetics of maize leaf elongation in increased yield threshold limits short-term elongation rates after exposure to salinity. (1991) J Exp Bot 42(11): 1417-1426.
- 27. Passioura, J.B., Munns, R. Rapid environmental changes that affect leaf water status induces transient surges or pauses in leaf expansion rate. (2000) Australian Journal of Plant Physiology 27(10): 941-948.
- 28. Saravanan, R.S., Rose, J.K.C. A critical evaluation of sample extraction techniques for enhanced proteomic analysis of recalcitrant plant tissues. (2004) Proteomics 4(9): 2522-2532.
- 29. Munns, R. Physiological processes limiting plant growth in saline soils: some dogmas and hypotheses. (1993) Plant Cell Environ 16(1): 15-24.
- 30. Munns, R. Comparative physiology of salt and water stress. (2002) Plant Cell Environ 25(2): 239-250.
- 31. Yamanaka, T., Miyama, M., Tada, Y. Transcriptome profiling of mangrove plant, Bruguiera gymnorhiza and identification of salt tolerance genes by Agrobacterium functional screening. (2009) Biosci Biotechnol Biochem in press 73(2): 304-310.
- 32. Su, P.H., Li HM. Arabidopsis stromal 70-kD heat shock proteins are essential for plant development and important for thermo tolerance of germinating seeds. (2008) Plant Physiol 146(3): 1231-1241.
- 33. Lee, J.H., Schoffl, F. An Hsp70 antisense gene affects the expression of HSP70/HSC70, the regulation of HSF, and the acquisition of thermo tolerance in transgenic Arabidopsis thaliana. (1996) Mol Gen Genet 252(1-2): 11-19.
- 34. Cho, E.K., Hong, C.B. Over expression of tobacco NtHSB70-1 contributes to drought-stress tolerance in plants. (2006) Plant Cell Rep 25(4): 349-358.
- 35. Ireland, H.E., Harding, S.J., Bonwick, G.A., et al. Evaluation of heat a. Shock protein 70 as a biomarker of environmental stress in Fucus serratus and Lemna a.minor. (2004) Biomarkers 9(2): 139–155.


