Identification of Mutations in Pit Genes of Genetic Disorders
Vanita P
Affiliation
Department of Biochemistry, Dr. L.B College, Visakhapatnam, India
Corresponding Author
Jhansi, K. Department of Biochemistry, Dr. L.B College, Visakhapatnam, India, Tel: +91 9885352429; E-mail: kondurujhansi68@gmail.com, Vanita, P. Department of Biochemistry, Dr. L.B College, Visakhapatnam, India, Tel: +91 9985924242; E-mail: vani.vnt1@gmail.com
Citation
Jhansi, K., Pudata, V. Identification of Mutations in Pit Genes of Genetic Disorders. (2017) Clin Trials Pathol Case Stud 2(1): 53- 57.
Copy rights
© 2017 Jhansi, K. This is an Open access article distributed under the terms of Creative Commons Attribution 4.0 International License.
Introduction
In the fetal development of the pituitary gland, a number of processes occur that affect cell proliferation and differentiation. Several steps revealed in molecular analyses that are required for pituitary cell line specification and have identified specific factors that control these steps. Pit-1 is a pituitary-specific transcription factor responsible for pituitary development and hormone expression in mammals[1].
Pituitary transcription factor-1 (Pit-1) is a tissue-specific homeodomain protein that specifies the development of pituitary somatotropes and lactotropes[2]. The gene encoding the pituitary transcription factor 1 (Pit-1) is expressed during differentiation steps that take place quite late in the development of the pituitary gland. Clinically, patients with mutations of the PIT1 gene are characterized by severe deficiencies in growth hormone (GH) and prolactin (PRL) and thyroid stimulating hormone (TSH). Pit-1 gene also cause gonadotrophin deficiencies and in some cases partial Adrenocorticotropic Hormone (ACTH) deficiency[3].
Pit-1 are not restricted to hormone gene regulation because this factor also contributes to cell division and protects the cell from programmed cell death[4]. First it is observed in mouse. Two nonallelic mouse mutations with severe dwarf phenotypes are characterized by a lack of growth hormone, prolactin, and thyroid stimulating hormone[5].
Pit-1 contains a DNA-binding region, consisting of a POU-specific domain and a POU homeodomain. Mutation of the Pit-1 gene causes hypoplasia of the pituitary gland and deficiencies of GH, PRL and TSH. In a DNA sample from a 3-month-old girl with severe growth deficiency from birth, single stranded conformational polymorphism analysis of the Pit-1 gene identified a gel shift in exon 6[6]. Mutations of the Pit-1 gene have been shown to be responsible for a syndrome of combined pituitary hormone deficiency (CPHD), including complete GH and PRL deficiencies and central hypothyroidism[7].
Types
Inactivating Pit-1 mutations: Pit-1, a POU-class nuclear DNA-binding transcription factor, specifies three of the parenchymal cell types in anterior pituitary ontogeny. Using fluorescent fusions and live cell imaging, we have compared the dynamic behavior of wild-type and inactivating Pit-1 point mutations[8].
Zebrafish pit1 mutants: The Pou domain transcription factor Pit-1 is required for lineage determination and cellular commitment processes during mammalian adenohypophysis development. Here we report the cloning and mutational analysis of a pit1 homolog from zebrafish. Compared with mouse, zebrafish pit1 starts to be expressed at a much earlier stage of adenohypophysis development.
Effects of the Pit1 mutation: Mutations in Caenorhabditis elegans and mice have identified candidate genes that increase their lifespan via hormonal signal transduction, i.e. the insulin/IGF-1-like pathway. In this study we propose that longevity of the Snell dwarf (Pit1(dw)/Pit1(dw)) mouse is associated with a decrease of the insulin/IGF-1 signaling pathway caused by the Pit1 mutation[9].
Methods
Isolation of blood samples
Blood samples is isolated from the multiple sclerosis patients and stored in sterile conditions at (-20°C)
DNA Isolation
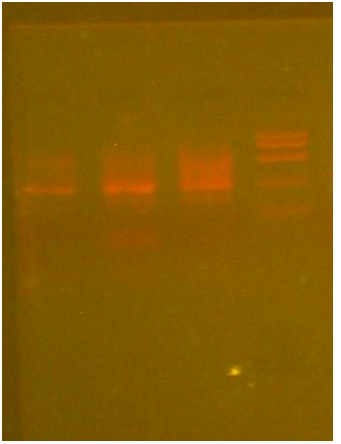
Lysis Buffer Method: 100 μl of blood sample was taken and 1ml of water was added to it, the contents were mixed well. It was centrifuged at 10000 rpm for 5 minutes, the supernatant was discarded and 600 μl of lysis buffer was added. Pellet was dissolved completely. It was incubated at 65°C for 15 minutes. The contents were allowed to cool to room temperature. To this 200 μl of sodium acetate was added, the contents were mixed well. It was centrifuged at 10,000 rpm for 5 minutes. The supernatant was added to a fresh eppendorf tube 600 μl of isopropanol was added to the supernatant and mixed well. It was incubated at -20°C for 30 minutes. It was centrifuged at 10,000 rpm for 2 minutes. The supernatant was discarded, 70% of ethanol was added to the pellet and it was centrifuged at 10,000 rpm for 2 minutes. The supernatant was discarded and the pellet was allowed to air dry. The pellet was dissolved in TE buffer. Bands can be observed in the presence of UV light after agarose electrophoresis. (Figure1)
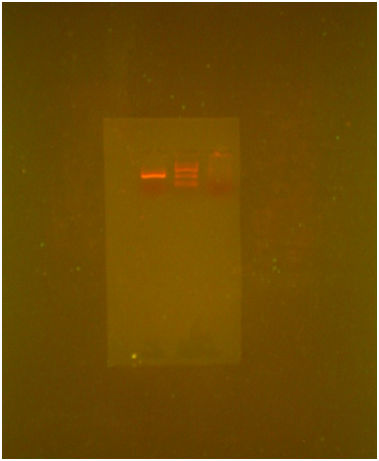
TE Buffer Method: Take 200 μl of patient blood sample and added 1ml of distilled water to it Mix the contents well and centrifuge it at 10,000 rpm for 5 minutes. Discard the supernatant save the pellet. If red color pellet was present the above step done again to get the white pellet. To the white pellet add 200 μl of TE buffer and dissolve the pellet completely. To the added 460 μl of 10% SDS incubate the contents at 65°C for 10 minutes. Add 400 μl of 24:25:1 PCI solution and vortex well. And centrifuge at 10,000 rpm for 5 minutes. Transfer the supernatant to a fresh eppendorf tube add equal volume of CI , 24:1 solution and vortex well and centrifuged at 10,000 rpm for 5 minutes. To the supernatant add 300 μl of 3M sodium acetate to the contents and add 150 μl of ice cold isopropanol to the supernatant centrifuge at 10,000 rpm for 5 minutes. If the pellet is not visible incubate at -20°C for 30 minutes. Centrifuge at 10,000 rpm for 5 minutes. Discard the supernatant and wash the pellet with 70% ethanol, centrifuge at 10,000 rpm for 2 minutes. Discard the supernatant and air dry the pellets completely till the ethanol completely evapourated, dissolve the pellet in TE buffer, then run the sample over agarose gel. Bands can be observed in presence of UV light.
Isolation of DNA from Rapid Method: Taken whattman filter paper disc, dipped in a TE buffer and allowed the paper to dry. To the dried paper disc added 2 μl of patient blood sample and allowed to it air dried. Kept the paper disc in eppendorf tube added 1ml of distilled water and vortex it for 2 minutes. Centrifuged at 10,000 rpm for 2 minutes. Discard the supernatant and save the paper disc. To the disc added 100 μl of TE buffer 100 μl of 10% SDS (ready template A and B) and incubated at 95°C for 10 minutes. Cooled it to room temperature and centrifuged at 10,000 rpm for 2 minutes. Taken the supernatant for PCR.
Amplification by PCR: Take the PCR tubes from -20°C and keep in ice box. Briefly spin all tubes for few seconds to settle down all the droplets sticking at the top or sides. Add the following components into PCR tubes provided.
Patient Blood Sample:
Master Mix 10 μl
Forward primer 1 μl
Reverse primer 1 μl
DNA sample 2 μl
Distilled water 6 μl
Total reaction mixture 20 μl
FOR GADPH:
Master Mix 10 μl
Forward primer 1 μl
Reverse primer 1 μl
DNA sample 2 μl
Distilled water 6 μl
Total reaction mixture 20 μl
Master Mix Contains Components:
Distilled water
Buffer
Taq polymerase
DNTP’S
Total reaction mixture volume taken 10 μl to run PCR Placed the tubes in thermal cycles and programme the number of cycles, temperature duration time as given below
Step 1: Initial denaturation at 94°C for 3 minutes.
Step 2: Final denaturizing at 94°C for 30 seconds
Step 3: Annealing temperature at 58°C for 30 seconds.
Step 4: Extension at 72°C for 30 seconds.
Step 5: Repeat the step 2 for 30 cycles.
Step 6: Final extension at 72°C for 30 seconds.
Step 7: 10°C for 1 minute.
Collect the tubes from thermal cycle.
Resolve the sample in agarose gel electrophoresis.
Purification of PCR Products: After amplification 20 μl of PCR product is isolated is loaded in 2% agarose gel electrophoresis from confirming the amplifications. The rest of the PCR products are taken for analysis.
Results
Isolation of blood sample: The blood sample is taken from patients who suffered with multiple sclerosis disease. Then blood sample is transferred to sterile eppendoff tubes for further analysis. The collected blood sample was stored in at -20°C without contamination.
Isolation of DNA by Lysis buffer protocol (Figure 1): The whole genomic DNA was isolated for patient blood by using Lysis buffer (murick KV, Gelbart WM 2002). Protocol for effective cell lysis and for maximum yield by using lysis buffer, sodium acetate, 70% ethanol, isopropanol and TE buffer. The isolated DNA was run in 0.7% agarose gel and protein contamination was observed.
Isolation of DNA by TE buffer Method (Figure 2): The whole genomic DNA was isolated form patient blood by using TE buffer (Mullis, Kary1990) protocol for effective cell lysis and for maximum yield by using TE buffer, TE buffer, sodiumacetate, isopropanal and ethanol. The isolated DNA was run in 0.8% agarose gel and rna contamination was observed.
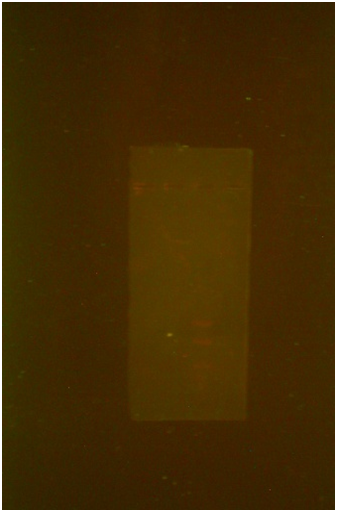
Isolation of DNA by Rapid protocol: The blood sample was collected from patients the DNA isolated from sample containing 2 l of blood is kept for amplification by using Exon; 3 primers. The amplification products were run in 2% agarose gel.
Lysis Buffer (Figure1): DNA was initially isolated from blood sample using the lysis buffer protocol and the following result is obtained on Agarose gel electrophoresis.
Well-1 sample
Well-2 patient blood
Well-3 molecular weight (Hind 3)
Well-4 DNA ladder
TE Buffer protocol (Figure 2): DNA was initially from blood sample using the TE buffer protocol and following result was obtained on Agarose gel electrophoresis.
Well-1-Sample
Well-2-patient blood
Well-3-molecular weight (Hind 3)
Rapid protocol (Figure 3): DNA was initially from blood sample using the ready template A and B protocol and following result was obtained on Agarose gel electrophoresis.
Well-1 sample
Well-2 patient blood
Well-3 lader 100 bp
Sequence
Forward Primer: GCAGGTAGTGAGAATTGAATCG
Reverse Primer: CGGTCATATGTAAACTGTCATAGGAGT
CTCAGAGCCTTCCTGATGTATATATGCAGGTAGTGAGAATTGAATCGGCCCTTTGAGACAGTAATA
TAATAAAACTTGATTTGGGGAGCAGCGGTTCTCCTTATTTTTCTACTCTCTTGTGGGAATGAGTTG
CCAAGCTTTTACTTCGGCTGATACCTTTATACCTCTGAATTCTGACGCCTCTGCAACTCTGCCTCT
GATAATGCATCACAGTGCTGCCGAGTGTCTACCAGTCTCCAACCATGCCACCAATGTGATGTCTACA
GGTACTGACTCCTATGACAGTTTACATATGACCG
Pit 2 gene
1 AGGATCCCAA GGCCCAACTC CCCGAACCAC TCAGGGTCCT GTGGACAGCT CACCTAGCTG
61 CAATGGCTAC AGGCTCCCGG ACGTCCCTGC TCCTGGCTTT TGGCCTGCTC TGCCTGCCCT
121 GGCTTCAAGA GGGCAGTGCC TTCCCAACCA TTCCCTTATC CAGGCTTTTT GACAACGCTA
181 TGCTCCGCGC CCATCGTCTG CACCAGCTGG CCTTTGACAC CTACCAGGAG TTTAACCCCC
Forward Primer: CCCATCTATTTTGTCTTTGATCC
Reverse Primer: TCCATCTAAGTGTCCCCAAA
Pit 3 gene
1 AGACCTCCCT CTGTTTCTCA GAGTCTATTC CGACACCCTC CAACAGGGAG GAAACACAAC
61 AGAAATCCAA CCTAGAGCTG CTCCGCATCT CCCTGCTGCT CATCCAGTCG TGGCTGGAGC
121 CCGTGCAGTT CCTCAGGAGT GTCTTCGCCA ACAGCCTGGT GTACGGCGCC TCTGACAGCA
181 ACGTCTATGA CCTCCTAAAG GACCTAGAGG AAGGCATCCA AACGCTGATG GGGAGGCTGG
241 AAGATGGCAG CCCCCGGACT GGGCAGATCT TCAAGCAGAC CTACAGCAAG TTCGACACAA
300 ACTCACACAA CGATGACGCA CTACTCAAGA ACTACGGGCT GCTCTACTGC TTCAGGAAGG
Forward Primer: TGACAAATGGTCTTTTTCATTTT
Reverse Primer: CCAAGTTCTTTTTCCTGTTGC
Discussion
In the present study, we performed mutational analysis of the PIT1 genes in a cohort of 40 patients with idiopathic hypopituitarism followed in one large neuroendocrinology Hospital, Guntur, Andhra Pradesh, India. Since LHX4 and HESX1 are more likely to be associated with EPP, and LHX3, PIT1, PROP1, and HESX1 with NPPP (Fox, set al., 1995),We have analyzed the Pit-1 sequence of three apparently independent families in which hypopituitary children are homozygous and phenotypically normal parents are heterozygous for a Pro239Ser mutation.
Proline 239 is strictly conserved among the Pit-1 proteins of several species and among other related POU proteins, implying that it must play an important role in Pit-1 activity. This residue is located at the beginning of the second -helix of the homeodomain, which was originally described as the Pit-1 DNA binding domain (Ingraham etal 1988). In gel retardation experiments, we show that the Pro239Ser mutant form of Pit-1 is still able to recognize the first Pit-1 binding site of the human PRL proximal promoter and specifically binds to this sequence with about the same affinity as the wild-type Pit-1. These results are in agreement with the three-dimensional conformation of the POU domain [recently established for Oct-1 and for the Pit-1 POU domain cocrystallized with their respective binding sequence], which seems to indicate that residue 239 is not in direct contact with DNA. In addition, Proline 239 occupies the N-cap position of the helix 2 in the Pit-1 homeodomain. Prolines are frequent at N-cap positions of -helices, where they play a stabilizing role. In our mutant, proline 239 is replaced by a serine, another residue known to have a stabilizing effect on -helices when in the N-cap position. Thus, one should not expect the stability of the second -helix of the Pit-1 homeodomain, and hence the conformation of the protein, to be seriously affected by the Pro239Ser mutation
Furthermore, a genetic screen used to define the important residues for Pit-1 DNA-binding, based on loss of function of fusion proteins between the transactivation domain of GCN4 and chemically mutated Pit-1 DNA binding domains, failed to detect the Pro239Ser mutation described here. All these considerations support our finding that this Pit-1 variant is capable of binding DNA with the same affinity as the wild-type form.
The results of our cotransfection experiments clearly show that the Pro239Ser mutation causes complete loss of transactivation activity. The hypothesis of nonexpression of the mutated protein in HeLa cells must be rejected, because activation by wild-type Pit-1 is partially inhibited when the vector bearing the mutated cDNA is also present. Without expression of this cDNA, such an effect would be hard to explain. When pRSVPit-1WT and pRSVPit-1M are present in equal amount (7 or 14 µg each) in cotransfected cells, the transactivation potential of wild-type Pit-1 is reduced by 50% These in vitro results are in keeping with the clinically observed recessive phenotype of this mutation if we assume that a 50%-reduced level of Pit-1 activity is sufficient to ensure a normal phenotype.
Because Pit-1 forms dimers on DNA through its POU-specific domain, two mechanisms might account for the ability of the mutant to repress wild type Pit-1 activity: competition between mutated and wild-type Pit-1 for DNA binding sites; or formation of inactive heterodimers. The first possibility must be rejected because the reporter plasmid was in excess in our experiments [as shown by the 2-fold increase of CAT activity observed when the amount of vector expressing wild-type Pit-1 was doubled, whether this vector was present alone or in combination with the vector expressing the mutated form (Figure 4)]. We therefore suggest that the observed inhibitory effect of the Pro239Ser protein is caused by formation of heterodimers that can bind to DNA but cannot stimulate transcription, as is the case with mutant homodimers. This model suggests that the mutation of Pro239 into a serine abolishes the interaction of Pit-1 with another factor(s) required for transcriptional activation.
In brief, our data show that a single point mutation in codon 239 of the Pit-1 gene, causing the substitution of a serine for a proline, leads to the phenotype of GH, PRL, and TSH deficiency and hypoplasia of the anterior pituitary, when present in both Pit-1 alleles. Because heterozygous individuals are seemingly unaffected, it further seems that a 50%-reduced level of Pit-1 activity is sufficient to ensure a normal phenotype. The newly recognized, natural, recessive Pit-1 mutation that we describe has been found in only three Middle Eastern families. The relatively frequent and apparently exclusive occurrence of this mutation in a defined geographic region is striking. This occurrence may be based on a so-called founder effect, the three families having a single and common heterozygous ancestor in whom this mutation first arose. Alternatively, we may be in the presence of a hot spot for mutations in the Pit-1 gene within this ethnic community, distinct from the Arg271Trp hot spot that has been described in Caucasians and Mongolians.
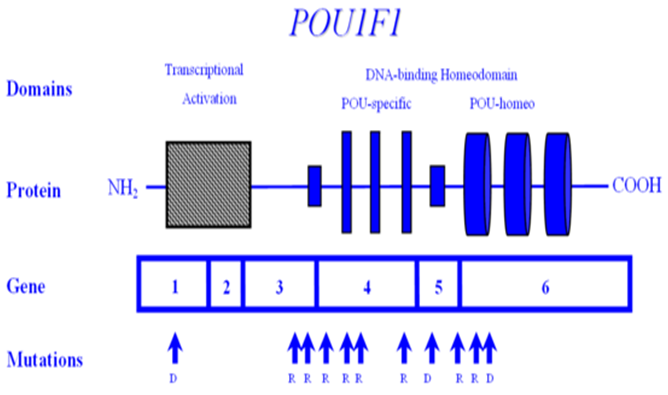
POU1F1 encodes the POU1F1 transcription factor, also known as PIT1, which is required for the development and function of three major cell lines of anterior pituitary: somatotropes, lactotropes and thyrotropes. Various mutations in the gene encoding POU1F1 have been described, resulting in a syndrome of multiple pituitary hormone deficiency involving GH, PRL and TSH hormones. POU1F1 is located on 3p11 and consists of six exons encoding 291 amino acids. Many mutations of POU1F1 have been described; some are inherited as autosomal recessive and some as autosomal dominant. There is a wide variety of clinical presentation in patients with POUF1 mutations. Generally, GH and prolactin deficiencies are seen early in life. However, TSH deficiency can be highly variable with presentation later in childhood or normal T4 secretion can be preserved into the 3rd decade. To date, POU1F1 mutations have been described in a total of 46 patients from 34 families originating in 17 different countries. Recessive mutations are generally associated with decreased activation, while dominant mutations have been shown to bind but not trans-activate i.e. act as dominant-negative mutations, rather than through haplo-insufficiency. One such mutation is the recurrent Arg271Trp (R271W), located in exon 6, which results from a C --> T transition at a CpG dinucleotide, i.e. a region predisposed to spontaneous mutagenesis. Another interesting mutation is the Lys216Glu mutation of exon 5. This mutation is unique in that the mutant transcription factor activates both the GH and PRL promoters at levels greater than wild-type (i.e. acts as a superagonist), but down-regulates its own (i.e. the POU1F1) promoter-leading to decreased expression of PIT1. R271W is the most frequent mutation of POU1F1. A recent report describing a novel mutational hot spot (E230K) in Maltese patients suggests a founder effect. The same group reported two additional novel mutations within POU1F1 gene; an insertion of a single base pair (ins778A) and a missense mutation (R172Q) (Figure 4).
Figure 1:
Conclusion
PIT1 gene lead to increased weaning weight, without increasing birth weight. However, the difference in PIT1 behavior observed between the two genetic groups denotes the need to test the effects of this polymorphism on different populations before using it in marker-assisted selection. It also indicates the need for a better understanding of the genetic mechanisms involved in the physiology of this pituitary transcription factor in the process of growth in cattle.
In mouse, the first spontaneous Pit-1 mutant, named Snell dwarf mouse, was already described in pituitary hormone deficiencies (CPHD) were shown to be caused by mutations in the human Pit-1 homolog. In our current research the Genomic DNA isolated from Patients sample and the Exon 1, 2 and 3 were amplified by PCR. The amplified Exons 1, 2 and 3 were sequenced. From the Sequence the Multiple sclerosis is because of mutation in Exon 3. The mutants were found in a large-scale screen for N-ethyl-N-nitrosourea-induced recessive mutations causing altered Growth hormone gene expression Juvenile and adult mutants display severe dwarfism, which appears even more dramatic than in mouse mutants and human patients. The analysis of the role of pit1 during zebrafish development turned out to be very helpful in further illuminating the mechanisms of pituitary patterning in fish. 1929. With its molecular cloning in 1990, Pit-1 was the first gene proven to be essential for mammalian pituitary development. Only two years later, several cases of human combined. Due mutation in Exon 3, leads to Prolactin, Growth Hormone and Thyroid Stimulating Hormone deficiency. Mutation at this particular exon may be due to several Factors.
References
- 1. Radovick, S., Nations, M., Du, Y., et al. A Mutation in the POU-Homeodomain of Pit-1 Responsible for Combined Pituitary Hormone Deficiency. (1992) Science 257(5073): 1115-1118.
Pubmed || Crossref || Others - 2. Lee, E.J., Russell, T., Hurley, L., et al. Pituitary Transcription Factor-1 Induces Transient Differentiation of Adult Hepatic Stem Cells into Prolactin-Producing Cells in Vivo. (2005) Mol Endocrinol 19(4): 964-971.
Pubmed || Crossref || Others - 3. McLennan, K., Jeske, Y., Cotterill, A., et al. Combined pituitary hormone deficiency in Australian children: clinical and genetic correlates. (2003) Clin Endocrinol (Oxf) 58(6): 785-794.
Pubmed || Crossref || Others - 4. Quentien, M.H., Barlier, A., Franc, J.L., et al. Pituitary transcription factors: from congenital deficiencies to gene therapy. (2006).
Pubmed || Crossref || Others - 5. Camper, S.A., Saunders, T.L., Katz, R.W., et al. The Pit-1 transcription factor gene is a candidate for the murine Snell dwarf mutation. (1990) Genomics 8(3): 586-590.
Pubmed || Crossref || Others - 6. Aarskog, D., Eiken, H.G., Bjerknes, R., et al. Pituitary dwarfism in the R271W Pit-1 gene mutation. (1997) Eur J Pediatr 156(11): 829-834.
Pubmed || Crossref || Others - 7. Pellegrini-Bouiller, I., Bélicar, P., Barlier, A., et al. A new mutation of the gene encoding the transcription factor Pit-1 is responsible for combined pituitary hormone deficiency. (1996) J Clin Endocrinol Metab 81(8): 2790-2796.
Pubmed || Crossref || Others - 8. Sharp, Z.D., Stenoien, D.L., Mancini, M.G., et al. Inactivating Pit-1 mutations alter subnuclear dynamics suggesting a protein misfolding and nuclear stress response. (2004) J Cell Biochem 92(4): 664-678.
Pubmed || Crossref || Others - 9. Hsieh, C.C., DeFord, J.H., Flurkey, K., et al. Effects of the Pit1 mutation on the insulin signaling pathway: implications on the longevity of the long-lived Snell dwarf mouse. (2002) Mech Ageing Dev 123(9): 1245-1255.
Pubmed || Crossref || Others


