Investigation of dose for the triple-source computed tomography based on Monte Carlo Simulations
Yi Chen, Zhenyu Yang, Yan Xi, Jun Zhao*
Affiliation
School of Biomedical Engineering, Shanghai Jiao Tong University, Shanghai 200240, China.
Corresponding Author
Jun Zhao, School of Biomedical Engineering, Shanghai Jiao Tong University, Shanghai 200240, China; E-mail: junzhao@sjtu.edu.cn>
Citation
Zhao, J., et al. Investigation of Dose for the Triple-Source Computed Tomography Based on Monte Carlo Simulations. (2016) Bioinfo Proteom Img Anal 2(2): 128- 134.
Copy rights
© 2016 Zhao, J. This is an Open access article distributed under the terms of Creative Commons
Attribution 4.0 International License.
Keywords
Triple-source CT; Monte Carlo; Dose
Abstract
Triple-Source Computed Tomography (TSCT) improves the temporal resolution by three times the conventional Single-Source Computed Tomography (SSCT).The theories and implementations of TSCT have been well established in previous studies. However, whether additional X-ray tubes increase the dose remains unknown. To solve this problem, a TSCT system was simulated by Monte Carlo simulation. For comparison, an SSCT was also simulated under the same condition. The source models of SSCT and TSCT were validated against the experimental result obtained from a literature. In the simulation experiment, a digital human body phantom was scanned by the simulated computed tomography systems, and the dose was calculated. Result of the comparison revealed that the total absorbed doses of SSCT and TSCT were almost equal under the same data requirements and the dose distribution of TSCT was more even. Given no additional dose and the improved temporal resolution, TSCT is a promising tool for dynamic imaging.
Introduction
Active objects, such as a beating heart, produce motion artifacts in computed tomography (CT) if the temporal resolution is inadequate. To improve temporal resolution, the concept of multiple-source CT scanner were proposed by using multiple X-ray sources and detectors, and various designs of multiple-source CT appeared in papers in the past few years[1-7]. Dual-Source CT (DSCT) with two X-ray tubes and two detectors is the first commercial multiple-source CT scanner that can reduce acquisition time by 44% at a fan angle of 25°[1]. DSCT has been successfully applied in cardiac imaging[8]. Triple-Source CT (TSCT) with three pairs of X-ray sources and detectors is also a multiple-source CT that can reduce acquisition time by 66.7%[9,10] and thus improves temporal resolution.
The dose delivered from a CT system should be as little as possible without degrading the image quality. This study investigated the dose of TSCT using Monte Carlo (MC) simulation. For comparison, a Single-Source CT (SSCT) was also simulated with the same settings.
MC methods repeat random sampling to compute results. These methods have been widely used to simulate radiation transport and calculate the radiation dose in medical imaging and radiation therapy[11,12]. To estimate the dose from CT, several MC models have been developed[13-16]. Previous studies[17-19] demonstrated that calculations based on MC approaches are consistent with experimental measurements. Among the various MC radiation transport code systems, EGSnrc[20] is one of the most commonly used.
In this study, we assessed the dose of TSCT by modeling the system with EGSnrc. For comparison, an SSCT was also simulated under the same condition. A digital human body phantom was scanned by the simulated CT systems to calculate the absorbed dose.
Methods
The doses delivered from SSCT and TSCT scanners were investigated by simulating the CT scan of an anthropomorphic phantom using the MC method. This section describes the details of the construction and validation of the MC model, as well as the application of this model for investigating the dose.
The flowchart is illustrated in Figure 1. SSCT and TSCT were composed of single source–detector pair. The model of a single source–detector pair was built according to a multislice CT (MSCT) scanner (a Light Speed 16; General Electric Healthcare Corporation, Waukesha, WI, USA). To validate the model, measurements of and compared with those measured in the real experiment using the MSCT scanner. The data of the real experiment were reported in literature[13]. After the validation, the SSCT and TSCT models were constructed from the source–detector pair model, and an anthropomorphic phantom was used in the simulation to investigate the dose distribution.
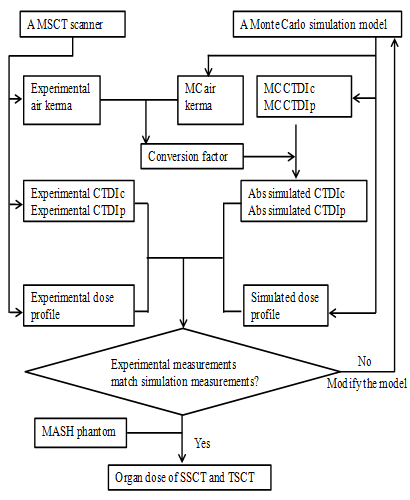
Figure 1: Flowchart of the development and validation of the CT scanner model. The measured data of the MSCT (multi-slice CT) were provided in the literature by DeMarcro et al[13]. The MC (Monte Carlo)
simulation was implemented by EGSnrc. CTDIc: CTDI central dose value. CTDIp: CTDI peripheral dose value.
MC Method
The simulation was implemented using EGSnrc MC software package[20]. This software package has been widely used to calculate the dose by simulating particle (photons, electron, and positron) interactions between photons and matter[21,23]. The easy particle propagation (Epp)[23] is a user code of EGSnrc to facilitate the simulation of X-ray imaging. In Epp, the input parameters, including geometry, source type, beam geometry, object information, and other parameters, are defined in an input file. The input geometries can either be defined in a voxelized matrix or in combinations of basic geometries, such as spheres, boxes, cylinders, and planes. This study performed the simulation based on EGSnrc and Epp. As the first step, the models of SSCT and TSCT were constructed.
SSCT and TSCT Scanners
SSCT has only one source–detector pair. By contrast, TSCT has three symmetrically distributed source–detector pairs (Figure 2); thus, the gantry only requires to be rotated over one third of a circle to acquire a full scan. Therefore, TSCT improvesthe in-plane temporal resolution by three times in the single-axial and helical scanning modes. In this study, we investigated the dose delivered by TSCT in helical mode. For reference, SSCT was also modeled, and the dose was calculated.

Figure 2: Schematic of the single source CT (a) and triple source CT (b).
In the helical scanning modes of TSCT and SSCT with the same helix pitch, the minimum detection window of TSCT is one-third of that of SSCT[24]. Thus, the required detector height of TSCT is one-third of that of SSCT if both CTs obtain complete datasets.
In this study, the TSCT had a 20 mm collimation (measured at the iso-center) and operated in helical mode with 60 mm helix pitch. To achieve a similar dataset, the SSCT had a 60 mm collimation and operated in helical mode with 60 mm helix pitch. The tube current of the two systems were modulated to ensure that the photon intensities obtained by the detectors of both systems were the same.
Source Model
In the simulations, each source–detector pair in TSCT was the same as that used in MSCT scanner (a Light Speed 16; General Electric Healthcare Corporation, Waukesha, WI, USA), which is a third-generation MSCT. The thickness of the beam collimation can be 20 mm at the iso-center, with a fan angle of 55°. Four tube voltages at 80, 100, 120, and 140 kVp are provided by this system, which can be operated in both single-axial and helical modes. The distance between the focal spot and iso-center is 54 cm, and the distance from the focal spot to the detector is 95 cm. This study focused on chest scan and used the body bowtie filter.
The focal spot was simulated as a point; thus, penumbra was not considered in this study. Although a simplified source model was used, the dose profile and CTDI values showed consistency (Model validation).
X-ray spectra were calculated from XOP2.3 software[25], which is a package for modeling of X-ray sources. The spectrum was generated with different tube voltages by setting the tube voltage and flat filter thickness (Figure 3).
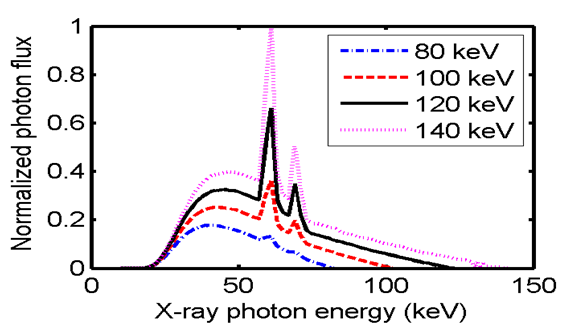
Figure 3: Photon energy spectrum used for simulating the X-ray source with a 2.5 mm aluminum filter.
Epp provides a direct definition of the collimated cone beam; thus, only the photons emitted in the region of interest were simulated. The physical effects relevant to photon propagation, including Rayleigh scattering, Compton scattering, atomic relaxations, and electron impact ionization, were considered. Other settings are listed in Table 1. The deposited energy of photons was calculated for each voxel along the photon pathway. The simulated body bowtie filter was made of aluminum, and the shape is illustrated in Figure 4.
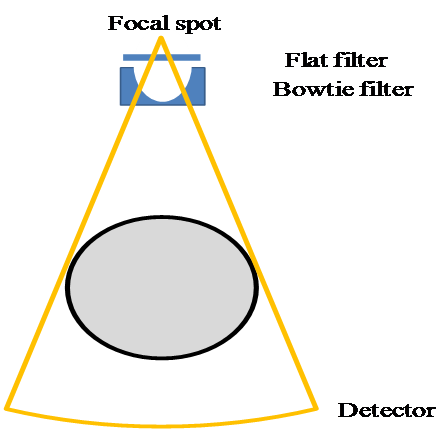
Figure 4: Modeled source–detector pair.
Table 1: EGSnrc parameters used in the simulations.
ParameterValue
Global ECUT 0.0
Global PCUT 0.001
Global SMAX 1e10
ESTEPE 0.25
XIMAX 0.5
Boundary crossing algorithm EXACT
Skin depth for BCA 0
Electron-step algorithm PRESTA-II
Spin effects On
Brems angular sampling Simple
Brems cross-sections BH
Bound Compton scattering On
Pair angular sampling Simple
Photoelectron angular sampling On
Rayleigh scattering On
Atomic relaxationsOn
Electron impact ionizationOn
Single-axial and helical scans were approximated by situating the sources equi-spatially along the circular or helicaltrajectory. Sampling more source positions results in more accurate scans, but requires more time to run the program. A previous study[26] reported that 16 source positions for each rotation were sufficient to approximate the source movement. Similar results were reported by another study[27], which shows that 18 source positions are sufficient. In this study, the trajectory was simulated in 16 angular positions for each rotation in both single-axial and helical scans.
CTDI Phantom and MASH Phantom
The standard body CTDI dosimetry phantom can be used to measure the dose in CT scan. This phantom is a cylinder made of PMMA with diameter and length of 32 and 15 cm, respectively. The phantom has five sockets, with one located at the center and the four others symmetrically distributed at the periphery. The sockets are 1.37 cm in diameter, and ion chambers can be inserted inside to measure the dose. The ion chamber was modeled as three concentric cylinders with a length of 10 cm[26,28]. The three cylinders with diameters of 13.7, 10.2, and 6.7 mm are filled with polyacetal, C552, and air, respectively [Figure 5(a),(b)]. The data of the materials were generated by a Preprocessor for EGS code (PEGS), which is a data preparation package that creates data to be used by EGSnrc[20].
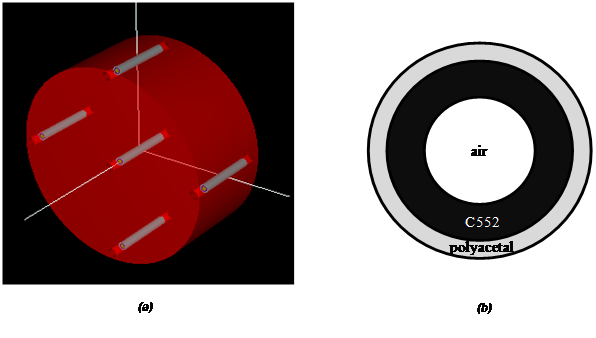
Figure 5: (a) Body CTDI dosimetry phantom with ion chambers in the sockets. The five gray cylinders are the ion chambers. (b) Transversal plane of the ion chamber.
Dose Calculation
Epp records the energy deposited at each voxel of the phantom and obtains the simulated dose (DS ; mGy), which is proportional to the used photon number in the simulation. To obtain the absolute value of dose, the conversion factor (CF)[26] from the simulated dose to absolute dose is determined as follows:
CTDIE,air(V)
CF(V) = ----------------- (1)
CRDIS,air(V)
where CTDIE,air is the in-air dose measured by the ion chamber at the scanner iso-center at a tube voltage V in the real experiment, CTDIS,air and is the dose obtained from the simulation under the same scan protocol. The absolute dose can be calculated from the simulated dose using the CF as
DA,V = DS,V X CF(V), (2)
where DA,V is the simulated dose at the tube voltage V, and DS,V is the absolute dose at the tube voltage V.
Validation of the source model
The model was validated by comparing the experimental and simulation measurements under the same protocol. The first test was based on the CTDI100 value measured inside the body CTDI phantom in single-axial scans. The CTDI100 values were measured by ion chambers placed inside the phantom sockets. In this test, various tube voltages, including 80, 100, 120, and 140 kVp, were considered[29,30]. The experimental data were obtained from a published literature[13]. The model of the CTDI phantom and chambers was simulated by Epp combined with the scanner model, and the simulated dose data were subsequently calculated.
In addition to the CTDI100 value, the dose profile at the CTDI phantom surface was also measured for further validation of the single-axial and helical scans. The metal-oxide-semiconductor field effect transistor (MOSFET) detectors were used to record the dose profile because the pencil chamber could not capture the spatial variation in longitudinal direction. A total of 20 MOSFET detectors were arranged on the surface of the CTDI phantom. The location of each MOSFET detector was reported by DeMarco et al.[13]. The scanner performed a single-axial and helical scan with 120 kVp and 20 mm beam collimation. In the simulation, the air kerma was scored along the trajectory of MOSFET detectors at the surface of the CTDI phantom with the same protocol.
Dose evaluation using MASH phantom
Male adult mesh (MASH), an adult anthropomorphic phantom[31], was used in this study to analyze the absorbed dose when performing TSCT and SSCT scans. MASH is composed of 526 x 236 x 1462 voxels with a voxel size of 1.2 mm x 1.2 mm x 1.2 mm. A total of 113 organs and tissues were simulated in the phantom. Each voxel was assigned with an exclusive number corresponding to the 113 regions. In our simulation, the original phantom was down sampled to 263 x 118 x 731 voxels with a voxel size of 2.4 mm x 2.4 mm x 2.4 mm to reduce the simulation time.
Both the SSCT and TSCT scans were modeled based on the validated source model. Chest scan was performed by the simulated SSCT and TSCT in helical mode. The scan range was −25 cm to 5 cm in the axis (the longitudinal direction; Figure 6). The dose was then calculated.
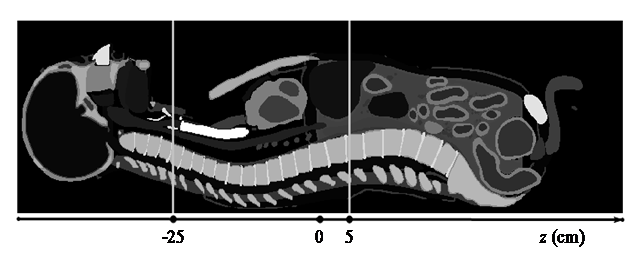
Figure 6: Sagittal plane of the MASH phantom and illustration of the chest scan. The gray level represents different organs/tissues.
Results
Conversion Factor
The tube voltage-dependent CF was calculated from single-axial scans. The dose was measured by the ion chamber at the iso-center of the scanner for tube voltages of 80, 100, 120, and 140 kVp with 20 mm collimation. The simulated CTDI value CTDIS,air (in units of mGy/8e7 incident photon) was calculated from the energy deposited in the ion chamber. The measured CTDI value CTDIM,air obtained from a published literature[13] was measured under the same setup. The CFs for each tube voltage were then calculated (Table 2).
Table 2: Conversion factors for converting simulated dose values into absolute dose values. The experimental CTDI was measured by pencil chambers positioned in air at the iso-center of the CT scanner, and the simulated CTDI was calculated by simulating the pencil chamber and CT scanner.
kVpCTDIE,air
(mGy)
CTDIS,air
(mGy/8e7 photon)
Conversion factor
808.13.70 × 10-62.19 × 10⁶
10014.73.44 × 10-6 4.27 × 10⁶
12022.713.42 × 10-66.64 × 10⁶
140 31.933.32 × 10-69.61 × 10⁶
Model validation
Two tests were performed to validate the source-detector pair model. The first test measured the CTDI values inside the phantom in the experiment and simulation. In the second test, the dose profiles were measured in the experiment and simulation.
CTDI value in experiment and simulation
The experimental CTDI value measured by the ion chamber under the same setup was obtained from a published literature[13]. The ion chambers were placed in phantom sockets, and the CTDI values at the center and periphery were measured. In the simulation, the body CTDI phantom was simulated to record the dose value at different locations. The CF was then used to obtain the absolute dose value in units of mGy. The simulated and measured results (Table 3) agreed well, and the largest difference between them was 6.66%.
Table 3: Comparison of the experimental and simulated dose results for the CTDI phantom. The pencil chambers were positioned at the center and periphery of the CTDI phantom.
kVpPositionExperimental CTDI100(mGy)Simulated CTDI100(mGy)Difference
80 Center1.341.361.41%
Peripheral3.453.624.89%
100Center2.973.176.66%
Peripheral6.666.761.44%
120Center5.124.98–2.67%
Peripheral10.4810.10–3.62%
140Center7.658.085.56%
Peripheral15.0114.39–4.16%
Surface dose profile in experiment and simulation
The dose profile was measured by MOSFET at the surface of the CTDI phantom[13]. The single-axial scan was performed at the centerline of the CTDI phantom. In the simulation, the dose profile was measured in the air at the phantom surface along the trajectory of MOSFET detectors. The results are illustrated in Figure 7(a). A total of 20 sample points were measured in the experiment because only 20 MOSFET detectors were used. The MC simulations recorded the dose with a large number of sample points; thus, the dose profile was smooth. The dose profiles from the experiment and simulation were consistent for the single-axial scan.
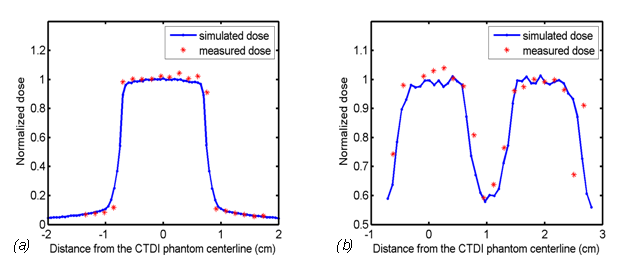
Figure 7: Simulated and measured dose profiles at the surface of the CTDI phantom in (a) a single-axial scan and (b) a helical scan with pitch = 0.9375 × 2 cm.
A comparison of the dose profiles was also performed for the helical scan. The helical pitch was 0.9375 × 2 cm in the experiment and simulation. The dose profile in the experiment was obtained from a literature[13], and the counterpart in the simulation was measured under the same protocol. The results in Figure 7(b) show that the dose profiles from the experiment and simulation were consistent for the helical scan.
Dose evaluation for SSCT and TSCT
The SSCT and TSCT models were constructed based on the validated source model, except that the beam thickness of SSCT was 6 cm and that of TSCT was 2 cm. To compare the absorbed doses of SSCT and TSCT, the simulations were performedunder the condition where the detectors received equivalent illuminance and equivalent noise in both scanners. In each view, the number of incident photons in the TSCT was set at 8 × 10⁷, which was the same as that used in the validation experiments. The incident number of photons in the SSCT was set to ensure that the number of primary photons received by a unit area of the SSCT detector was equivalent to that of the TSCT detector.
The number of incident photons for SSCT was set at 24 × 107. The photons received by the detectors were recorded by the simulation program with a tube voltage of 120 kVp. In the primary photon data, the relative errors were 1.19% and 1.22% in the TSCT and SSCT, respectively. The profiles of the primary photons received by the detector through air from the TSCT and SSCT are illustrated in Figure 8, which showed that both scanners received equivalent primary photons and similar relative error.
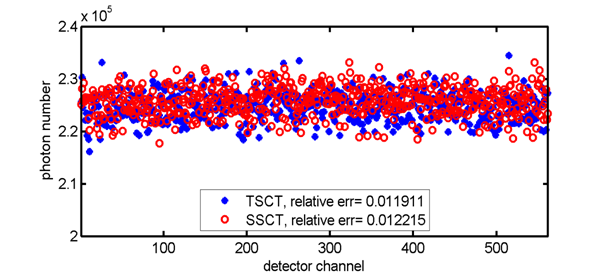
Figure 8: Profiles of the primary photons received by the detector through air from the TSCT and SSCT in the simulation.
The MASH phantom was then used to evaluate the SSCT and TSCT doses. The tube voltage was set at 120 kVp. The dose deposited in each voxel of the MASH phantom was calculated by Epp and multiplied by the CF to obtain the absolute dose value.
For each instance, the transversal dose distribution is displayed in Figure 9. Each displayed transverse plane had the same z position as that of the source (the definition of axis can be found in Figure 6). The dose value was normalized within [0,1], and the display window was set at [0, 0.5] for better visualization of the soft tissue. The illustrations show that the dose decayed rapidly along the X-ray transportation direction and the transversal dose distribution of TSCT was more uniform than that of SSCT.
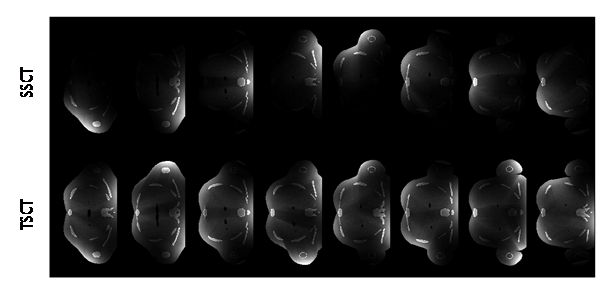
Figure 9: Transversal dose distribution for different instances. Each transverse plane had the same z position as that of the source. The angular difference was 45° between the adjacent columns. The dose value was normalized within [0, 1], and the display window was [0, 0.5] for better visualization of the soft tissue.
Figure 10 shows the distribution of the absorbed dose for the entire scan process. The dose values were between 0 and 74 mGy, but the display window was set at [0, 40 mGy] for better visualization. Figure 10 also shows that the sagittal dose distribution of TSCT was more uniform than that of SSCT for the entire scan process.
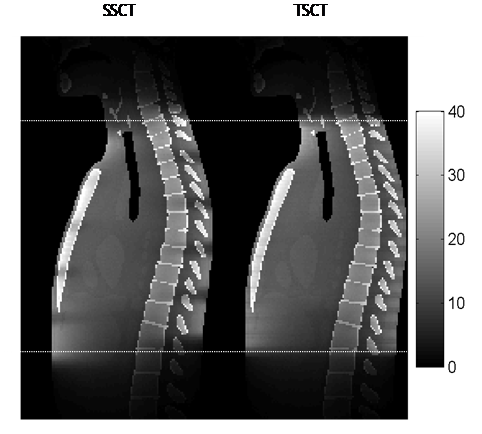
Figure 10: Dose distribution on the sagittal plane for the entire scan process. The dose values were within [0, 74 mGy], but the display window was set at [0, 40 mGy] for better visualization. The dotted line shows the start and end of the scan.
The absorbed dose for each organ was also investigated. The absorbed dose of an organ was calculated by averaging the dose deposited in all voxels corresponding to the organ. The result in Table 4 indicates that the total doses of TSCT and SSCT were almost equal for the organs inside the scan range (from the thymus to the spleen). For organs near the start or end of the scan range, such as the thyroid, stomach, and pancreas, the absorbed doses from TSCT and SSCT exhibited a difference as high as 29.05%. By contrast, a minimal difference (2.88%) was observed for tissues that are distributed over the body, such as the muscle, adipose subcutaneous, and skin.
Table 4: Comparison of the dose from TSCT and SSCT.
OrganDSSCTDTSCTDTSCT/DSSCT
Thyroid14.8619.1829.05%
Esophagus11.7111.931.90%
Thymus13.9514.000.34%
Lungs13.0313.090.47%
Trachea14.6715.374.74%
Bronchi13.2413.290.44%
Sternum, compact bone55.3255.380.11%
Thoracic spine, compact bone33.9034.963.12%
Adipose breasts9.9110.637.23%
Heart12.9412.950.05%
Spleen7.708.044.44%
Liver7.847.12–9.12%
Gall bladder wall1.541.26–18.26%
Pancreas1.881.59–15.02%
Adrenals7.437.744.16%
Stomach wall5.744.87–15.15%
Kidneys4.384.8711.32%
Muscle4.684.710.74%
Skin4.494.510.34%
Adipose subcutaneous3.683.792.88%
For the organs near the boundary of the scan range, the doses from SSCT and TSCT exhibited a large difference because the organs close to the X-ray tubes received higher dose than those located far from the tubes. Thus, this phenomenon of unevenness was more evident in SSCT. The effect of unevenness was reduced for the organs inside the scan range because they received doses from several rotations.
Discussion and Conclusion
In this study, we constructed SSCT and TSCT models based on the source model which was validated against the experimental result obtained from a published literature[13]. The MC simulation with the MASH phantom was implemented using the model to calculate the dose from SSCT and TSCT. The simulation experiment showed that the total absorbed doses of SSCT and TSCT were equivalent under the same data condition. Our result is consistent with the theoretical analysis[32].
TSCT may has a limited field of view because the space of CT gantry is limited. We can expect smaller sources in the future as new technologies are been developed. The Carbon Nano Tube (CNT) sources has small size and has been used in various CT designs[33,34]. If small X-ray tube such as CNT can be used in TSCT, more room could be made for the detector. On the other hand, if the region of interest is small, for example in cardiac imaging, the limited field of view is acceptable with interior tomography algorithms[35-37].
TSCT improves the temporal resolution and image quality for imaging of moving objects. Considering that TSCT requires only a narrow detector, the scatter is thus reduced, which may compensate for the extra scatter induced by the two additional sources.
Future investigations can assess the dose of TSCT more accurately after a standard system is developed. However, the MC simulation cannot be substituted because it obtains the dose distribution inside the human body. In contrast, the dose distribution inside human body is not easy to obtain in the real experiment. The combination of simulation and experiment can obtain more reliable data for research.
In this study, we did not consider the dose of DSCT for comparison because the dataset and scan protocol of DSCT are very different from SSCT and TSCT.
Acknowledge:
This work was supported by the National Natural Science Foundation of China (Grant No. 813716234), the National Basic Research Program of China (Grant No. 2010CB834302), the Shanghai Jiao Tong University Medical Engineering Cross Research Funds (Grant Nos. YG2013MS30 and YG2011MS51), and National Key Research and Development Program (Grant No. 2016YFC0104600)..
References
- 36. Yu, H., Wang, G. Compressed sensing based interior tomography. (2009) Phys Med Biol 54: 2791-2805.


