Ocean-Scale Monitoring of Mesozooplankton on Atlantic Meridional Transect 21
P.F. Culverhouse1*, R. Williams1, C. Gallienne2, J. Tilbury1, D. Wall-Palmer3
Affiliation
- 1Centre for Robotics & Neural Systems, Plymouth University, Plymouth, UK
- 2Plymouth Marine Laboratory, Prospect Place, Plymouth, UK
- 3School of Geography, Earth and Environmental Sciences, Plymouth University, Plymouth, UK
Corresponding Author
P.F. Culverhouse, Centre for Robotics & Neural Systems, Plymouth University, Plymouth PL4 8AA, Plymouth, Devon, UK, Tel: +44 (0) 1752 600600; E-mail: P.Culverhouse@plymouth.ac.uk
Citation
Culverhouse, P.F., et al. Ocean- Scale Monitoring of Mesozooplankton on Atlantic Meridional Transect 21. (2016) J Marine Biol Aquacult 2(1): 1- 13.
Copy rights
© 2016 Culverhouse, P.F. This is an Open access article distributed under the terms of Creative Commons Attribution 4.0 International License.
Abstract
An in-flow instrument for imaging and identifying meso-zooplankton from a ship’s clean pumped sea water supply, from 6m, is described. Meso-zooplankton abundance was measured continuously, from 38 transects and 36 net hauls (0 - 200m), on a 13,500 km passage from the Bay of Biscay to the southern Atlantic Ocean on Atlantic Meridian Transect 21.
A Line scan camera was used to give complete imaging of the in-flow water, in contrast to normal area scan cameras that sub-sample the flow. A total of 474 m³ of water was processed from transects and nearly 600,000 particles were imaged and categorized. Similarly, a total of 1901 m³ were processing from the early morning net hauls and over 300,000 biological specimens were categorized. The small and large copepod categories were dominated by the calanoid copepods although the most abundant harpacticoid in the 6m transect was Microsetella norvegica.
The value of underway monitoring is demonstrated by the presence of the filamentous cyanobacteria Trichodesmium spp., for the first time, throughout the North and South Atlantic Oceans from 48°N to 46°S. The effort required to complete the AMT 21 data analysis should allow ecological data to be extracted from net hauls and in-flow pumping within a week of the specimen images being available. This is more than a factor of ten faster than is currently possible using purely human effort alone. It is presented as a way of collecting biological samples that is faster, higher volume and at a greatly reduced cost to an entirely manual process. The large number and quality of images recorded provides an opportunity for the genera and species of much plankton to be determined by specialists. A complete set of data and images have been submitted to British Oceanographic Data Centre.
Introduction
The Atlantic Meridional Transect (AMT) programme is a series of cruises that began in 1995 during which biological, chemical and physical oceanographic research is carried out between the UK and destinations in the South Atlantic Ocean (Robinson et al. 2009). Despite the collection of zooplankton during many cruises, detailed analyses of the meso-zooplankton net hauls has never been carried out.
The longest running marine biological monitoring programme is the Continuous Plankton Recorder Survey, which was started in 1931 (Glover, 1967). As such it is the only survey to provide a measure of plankton communities on an ocean basin scale. The plankton samples are collected remotely but have to be analyzed back in the laboratory at Plymouth and elsewhere by trained plankton analysts. Delicate shells of some organisms (such as pteropods) are also damaged by this method of collection, making identification difficult. Storage in formalin is also not good for shelled organisms as, if the pH is not maintained the shells tend to dissolve, often making identification impossible. The CPR maintains an increasing scarce resource of expert plankton analysts and taxonomists who can take months to return results from the survey.
The difficulty with large scale surveys such as the AMT transect and the CPR is that human expertise is required to analyze the specimens collected. This is a bottleneck in the analysis of large ecological surveys, where an inevitable trade-off has to be made on size of survey with analysis capacity, quality and hence analysis time. Identification of specimens can be a subtle process, with differences between species revealed only by dissection of the specimen. However, at taxon level it is likely that morphological differences will be great enough to allow computer vision analysis and statistical pattern classifiers to discriminate between classes, genera and perhaps even down to species where the differences are profound.
Several autonomous continuous monitoring devices are available, including the EU Ferrybox, which is currently deployed on 30 European routes, many on ships-of-opportunity, the VENUS Observatory (for example Sato et al. 2013), and on University- National Oceanographic Laboratory System (UNOLS) in the USA. Primarily it is an on-board system able to accept a variety of sensors including salinity, temperature, dissolved O2 and fluorescence (Kaitala et al., 2014). In addition the ARGO network of buoys possesses integrated sensor suites (see http:// www.argo.ucsd.edu/About_Argo.html). Dubelaar and Gerritzen (2000) have been developing the Cytobouy for operational oceanography for some years. It is available as a ship-board flow–through instrument for the Ferrybox type instrument packs for algal and bacterial analysis (Rutten and Dubelaar 2015).
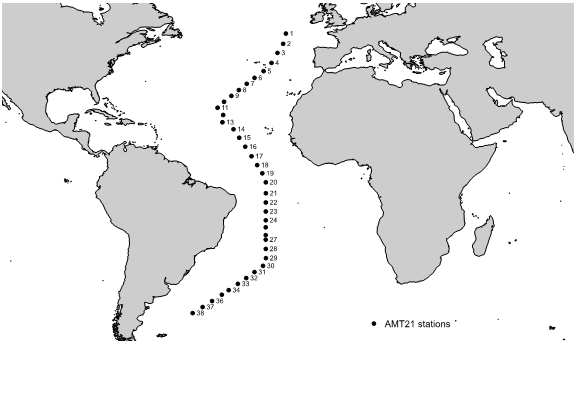
No instrument is available where meso-zooplankton is imaged, processed and identified underway. Such a system has been developed in Plymouth on the AMT cruises (see Fig. 1 for the cruise track of AMT21). Inflow samples were taken along transects between stations and net samples taken at each station. The Line-scan Zooplankton Analyser (LiZa) in-flow camera system is a real-time high-speed camera system capable of resolving to 10 micron with flow rates up to 17 liters per minute. The Plankton Image Analyser (PIA) is software for image analysis and identification. Particles are isolated from the images of the in-flow water stream in real-time and the imagery stored to system memory and then archived to hard drive. These are immediately available for expert or machine identification.
The objective of the study was to test the combination of LiZa camera and PIA software with both in-flows imaging over the daily transects and net samples of the AMT21 cruise completed Oct to December 2011. Details of the instrument’s design and operation are given in Culverhouse et al. (2015). This paper provides a cruise summary of the data collected from the Net hauls, and makes comparisons with the underway samples where appropriate.
Figure 1: AMT21 track through the north and south Atlantic.
Materials and Methods
Vertical net hauls were taken around 06.00 hrs local time at the start of each day.WP2 bongo nets with a 200-micron mesh were deployed from 200 m to surface. The cod end of the net was immediately flushed into a 30 liter holding tank with filtered seawater and then pumped through the Line-scan Zooplankton analyzer and the Plankton image analyzer (LiZa/PIA). Imaging took no more than 10 minutes, specimens were returned to the holding tank via a 200-micron filter that removed the specimens and provided a water mixing action to stir the contents of the tank. The filter was washed into sample vials, the specimens fixed using buffered formalin and stored for archival purposes.
The LiZa/PIA system was then connected to the ships clean pumped-water supply, drawn from 6m below sea level on AMT21, for the remainder of the 24-hr period until the next waypoint. Each net deployment sampled approximately 54.4 cubic meters of water, whereas the underway sample between transect waypoints averaged 16 cubic meters of water. The data for underway samples have all been summed for the duration of each transect and plotted at the end-point of the transect segment. The net hauls were taken prior to each cruise segment and thus record the abundances at the start of each day.
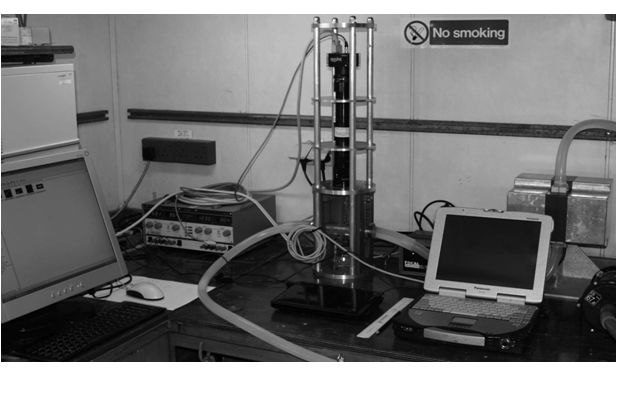
The LiZa in-flow camera system was connected to the ship’s clean water supply that allowed transect water samples to be taken continuously for up to 22.5 hours per day, drawn from 6 m below the sea surface on the RRS Discovery (AMT21). The images of particles were captured in real-time and stored to a hard drive. These were immediately available for automated classification using the PIA pattern analyzer. Specimen images were processed for features and subsequently classified in near real-time in a background process on the imaging computer. Close to one million particles were acquired on AMT21 for both underway and net samples comprising microplankton, mesoplankton, fish larvae and sampling artefacts (predominately air bubbles) at a flow rate of 12.5 ± 0.49 liters per minute. The cruise setup for LIZa/PIA is shown in Figure 2. A total of 38 transect and 36 net hauls were taken during the passage of the ship.
Figure 2: LiZa on board cruise AMT21, showing optics (central) and pumped water supply hoses (right), PIA ran on the computer (left). (See Culverhouse et al. 2015).
Classification difficulties are caused by the presence of detritus when directly imaging the in-flow water stream. Detritus can take on very diverse morphologies with detrital particles being formed from broken, decayed body parts or ecdysis, which have an appearance of a living organism. This causes false positive identifications to be made by the machine classifiers. The magnitude of the problem depends on the amount of detritus in the water sample, since no filtering is done when operating in situ or from a pumped water supply, unlike net sampling where microplankton and small detritus is filtered out by the 200-micron mesh of the net. The higher the abundance of detritus, the more likely it will show up in other category bins. It is for this reason the Zooscan semi-automatic methodology (Gorsky et al. 2010) was adopted for sample processing because it allows an operator to intervene to remove obvious mistakes in machine identification.
Analysis categories were set to: artefacts; blurred; Chaetognatha; large Copepoda (copepoda longer than 1mm); eggs; nauplii; Ostracoda; small Copepoda (Copepoda shorter than 1 mm) including Calanidae, Cyclopoida (Oithona spp.) and Harpacticoida; filamentous cyanobacteria Trichodesmium spp. (single strands and clusters of T. thiebautii, Gomont(1892) and T. erythraeum, Ehrenberg 1830) and unclassified specimens as a catch-all for everything else. Initially, there were insufficient images of Chaetognatha, Ostracoda, Gastropoda (including species such as the the cosomate pteropod Cresei ssp.), Decapoda, polychaete worms, salps and other imaged groups to make these categories useful for training the PIA classifier. Air bubbles were present due to the nature of the vessel water inlet and ship pump characteristics.
The imager sampled the field of view at a pixel resolution of 10 micron. Images were gathered that ranged in size from less than 50 by 50 pixels for foraminifera and dinoflagellates to greater than 500 by 1,000 pixels for whole coelenterates, chaetognaths and juvenile fish. Images are variable in grey-level contrast according to the illumination intensity and the density of the target specimen. They were stored as uncompressed 16-bit TIFF format files to preserve image features. It proved difficult to identify particles that were smaller than 20 by 20 pixels, and so these were rejected from subsequent processing.
Results
A total of 474 cubic meters of water were pumped through the system in the 38 underway transect samples, where a total 396,000 biological specimens and detrital particles were obtained and a further 200,000 air bubbles and other artefacts, which were rejected. All sampling artefacts were removed and the results plotted. A total of 1901 m³ was sampled in the 36 net hauls, giving 306,000 biological specimens and 8,000 artifacts. Transect sample 22 exhibited very low numbers of many of the categories, excepting copepods. A possible cause is a lower than average pumped volume of 4 m³ compared with the norm of 14 m³. Net haul samples 23 and 33 were not available for analysis. Two net haul samples (samples 4 and 35) had more than 1000 artifacts present; all were small air bubbles and were of unknown origin.
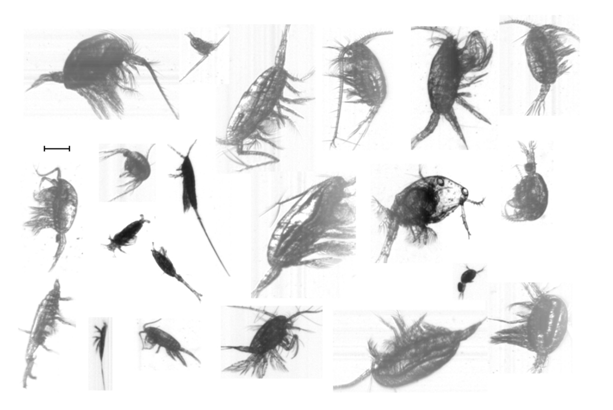
Figure 3: Images of copepoda. Scale bar 0.5 mm (see also Fig.7 Culverhouse et al. 2015).
Ecological analysis
There are over 700 species of copepods recorded in the northern regions of the transect and over 300 species in the southern and south-western Atlantic Ocean. A large percentage (> 70%) of these copepods belong to the Calanoida with over 180 species being present in both regions. The majority of information on the biodiversity of copepods in the southern Atlantic Ocean comes from Wolfenden (1911). There is little current literature on the copepod biodiversity of the Atlantic Ocean. The large number and quality of copepod images recorded (examples in Figure. 3 and in Culverhouse et al. 2015) from AMT 21 provides an opportunity for the genera and species of many copepods to be determined by a copepod specialist and to further work on the collected 0 - 200 m net hauls.
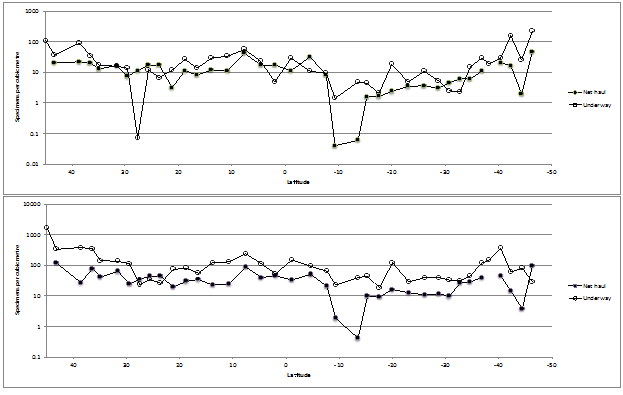
The large copepods ( > 1 mm) were present at roughly an order of magnitude less than the small (< 1 mm) copepods in both horizontal transects and net hauls (Figure. 4) as expected (Gallienne et al., 2001). The ratio of the large to small copepods along the transect declines from a high of [106:1660] specimens per m3 in the northern transects to a low of [215:28] specimens per m³ in the southern transects. Thirty-five samples exhibited the expected large:small ratio 1:10, the most southern transect sample (46°S 50°W) showed the reverse at a sample position that corresponds to Longhurst’s subtropical convergence province.
The mean ratio of small:large is 15.97:1 (std. dev. = 55.4) for the underway samples, but a smaller ratio of 4.58:1 (std. dev. = 7.27) for the net hauls over the entire cruise transect.
These data probably reflect the sample timing, with the first samples of the transect being made in the autumn in the Bay of Biscay and the final samples being in spring in the southern Atlantic Ocean.
Figure 4: Underway and net haul distribution of (a) large Copepoda (> 1 mm) and (b) small Copepoda (< 1 mm) per m3
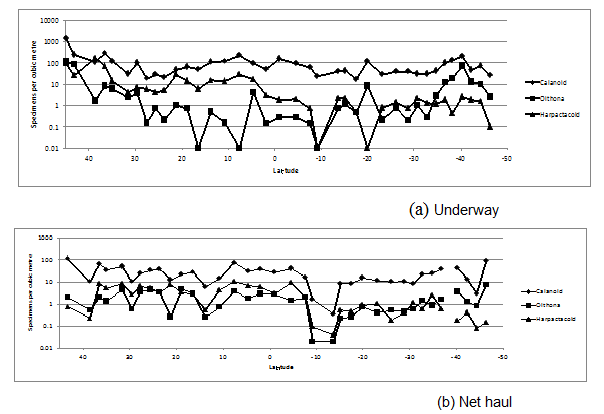
The small copepod category was dominated by the calanoid copepods throughout the AMT. The category also included many other species of cyclopoid and harpacticoid (smaller Copilia spp. Corycaeus spp. and Oncaea spp.), which were not discriminated in this study. The harpacticoid and the cyclopoid contribution to the small copepod category increased in the southern part of the AMT transect (Figure.5). Gallienne and Robins (2001) concluded, from net samples, that Oithona spp. was one of the most common genus of copepods in the Atlantic Ocean but in the AMT transect, at 6 m depth, the harpacticoid Microsetella norvegica, Boeck 1864 was more abundant for the majority of the AMT transect, especially underway transects 1 to 21. In the net hauls (0 - 200 m) Microsetella norvegica was less abundant progressing further south. Vertical haul 17 (10.7° N 31.84° W) had 533 harpacticoid present mostly Oncaea spp. but included 73 Microsetella sp. (14%) and this percentage contribution to harpacticoida decreased further in the southern net hauls. This confirms the concentration of Microsetella spp. in the near surface euphotic zone.
Figure 5: Underwayand net haul distribution of Calanoida, Cyclopoida (Oithona spp.) and Harpacticoida distribution across the Atlantic Ocean in AM21.
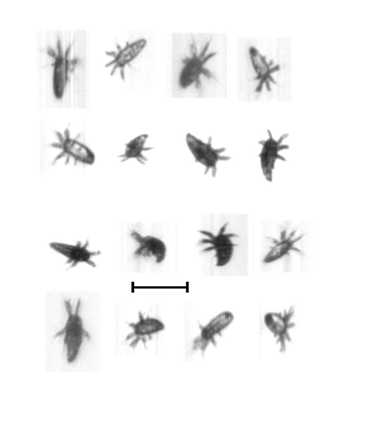
Figure 6: Selected images of crustaceannauplii(and see Culverhouse et al. 2015). Scale bar: 0.5 mm.
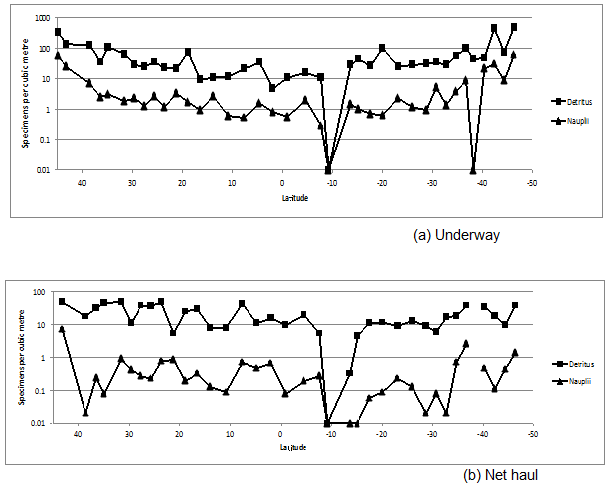
Nauplii distributions (Figure.7) are expected to be in low numbers in the autumn as seen in the early transects (transect 1 with 54 per m-3), near the Bay of Biscay, and rising in the spring in the later transects in the southern Atlantic Ocean (sample 38 with 56 per m3). The average abundance through the rest of the cruise was less than 10 per m3.
It is of interest to note that detritus (Figure. 7) is an order of magnitude higher in abundance than most living material, except small copepods. The contribution of turbulence from the ships pumped sea water damaging the planktons is not clear. However, damage to the larger decapods and larger coelenterates, when compared to plankton from the net hauls, was observed. This is an issue for any pumped supply and certainly for future ferry-box monitoring systems. Detritus is higher in the underway samples (average 2624 items per m³) than in the net samples (average 704 items per m³), given the sampled volume of 474 m³ (underway) and 1901 m³ (net hauls). This imaging technique, for the first time, gives us a measure to quantify the amount of ‘detritus’ in plankton samples. This cannot be measured or quantified using microscopic techniques.
Figure 7: Underway and Net haul plots of detritus and nauplii.
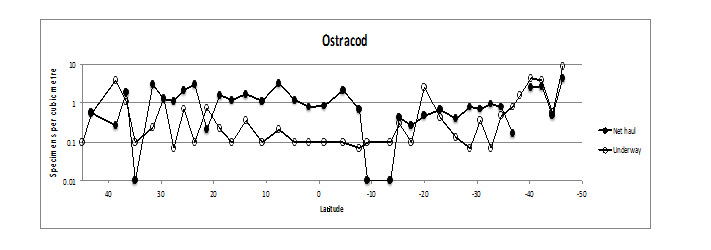
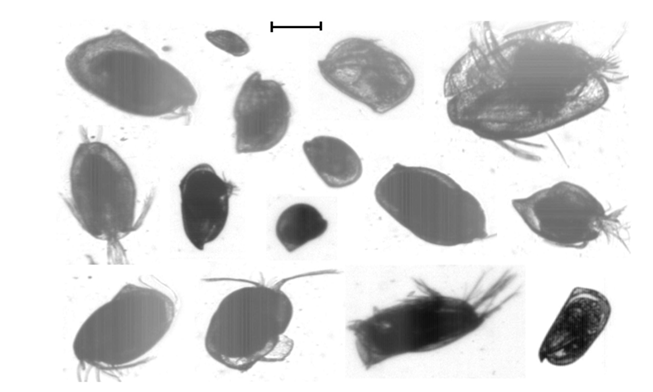
Ostracods were present in all transects and net hauls along AMT21. They were more abundant in the net hauls than in the transects except for transect 5 (38°-36°N), 12 (23°-21°N), 27 (18° - 20°S)) and for the final 6 transects (32° - 46°S) (see Figure. 8). The greatest abundance occurred in the most southern transect in both horizontal (8.9 specimens m³ between 44° -46° S) and its associated vertical hauls (4.3 m³). The majority of the Ostracoda from AMT21 were in the genus Conchoecia spp. (Figure. 9).
Figure 8: Underwayand vertical (0 - 200 m) net haul distribution of Ostracoda. Numbers per m3.
Figure 9: Selected images of Ostracoda (and see Culverhouse et al. 2015). Scale bar: 0.5 mm
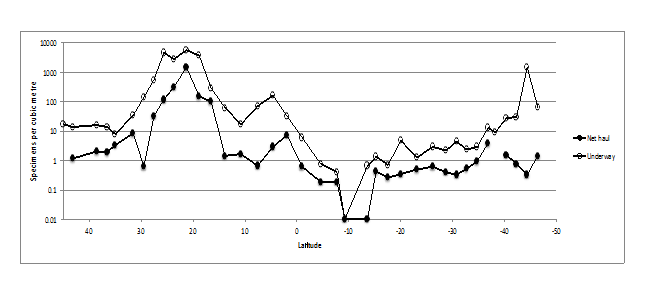
Trichodesmium spp. (Figures.10,11) reached its maximum abundance of 5600 single filaments per m-3in the northern Atlantic Ocean (25°N 38°W to 16°N 35°W) in transects 10 - 13 associated with the North Atlantic tropical gyral province and in the South Atlantic Ocean (42°S 44°W to 44°S 50°W) corresponding to Longhurst’s subtropical convergence province. Trichodesmium spp. were present in the underway transects at a factor of x10 over the data from the net hauls (Figure. 10). The difference in the shallow underway sampling using the pump seawater compared to the net hauls illustrates the value of underway monitoring of these filamentous cyanobacteria. Their presence throughout the North and South Atlantic Oceans from 48°N to 46°S is shown for the first time and is the result of sampling pumped volumes averaging 14 cubic meters per transect. Numbers reached 81,000 single and aggregated filaments in transect 12 and slowed the PIA analyzer sample processing.
The abundance, distribution and life cycle of the harpacticoid copepod, Macrosetella gracilis (Dana, 1852) is associated with Trichodesmium (Calef, et al. 1966, Bottger-Schnack, et al. 1989). It deposits its eggs for development of its naupliar stages and feeds on these filamentous cyanobacteria (O’Neil, et al. 1992, O’Neil, 1998). Macrosetella gracilis (length 1.13 - 1.50 mm) reached a peak abundance in transect 17 (7° to 4°N) and were common in the >1mm copepod size category. From its vertical distribution it is not unreasonable to suggest a similar association of Microsetella norvegica (length 0.33 - 0.53 mm) to the blue green algae.
Figure 10: Underway and net haul distribution of Trichodesmium spp. across the Atlantic Ocean in AMT 21. Numbers per m3.
Figure 11: Images of Trichodesmiumthiebautii (top row) and T.erythraeum (bottom row) Scale bar 0.5mm (and see Culverhouse et al. 2015).
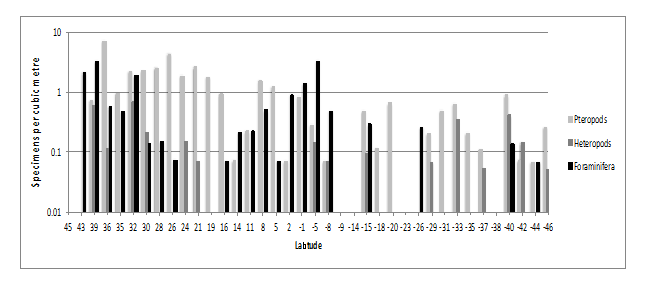
An example of how the specimens may be further sorted was the analysis of the unclassified underway samples, which were reviewed for pteropods, heteropods and foraminifera. This work, on all 38 samples, was completed, post-cruise, in less than 8 hours. A maximum of 59 specimens of pteropods, 9 heteropods and 47 foraminifera were identified from underway samples. It was possible to place these into 10 categories of pteropods, 4 of heteropodsand 5 of foraminifera. These accounted for less than 1% of the unclassified specimens and demonstrate how these data can be mined for more information. See Figure.12.
Figure 12: Underway distribution of pteropods, heteropods and foraminifera abundance.Numbers per m³.
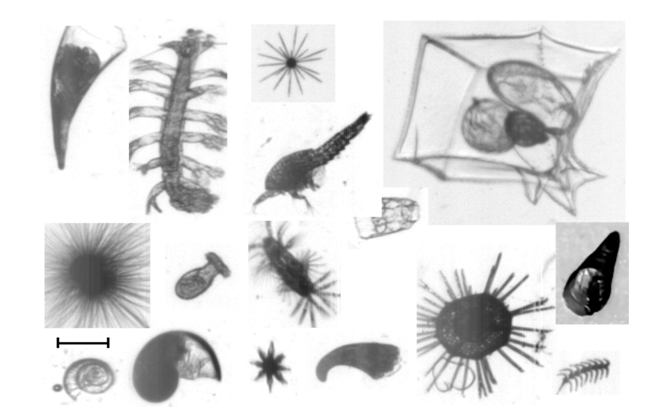
Due to the selection of categories in this study there were large numbers of unclassified specimens that were insufficient in number to place into taxonomic groups. See Figure.13. It was the intention to offer this class of data to other analysts in the future, so as to improve and refine our recognition system and to further understand distributions along AMT cruise tracks.
Figure 13: AMT21 examples of the unclassified category of specimens. Scale bar 0.5 mm. See further images in Figure. 3 and Figure. 18 in Culverhouse et al. 2015.
Comparison between net haul manual analysis and PIA
To make a comparison between plankton abundance acquired by the LiZa/PIA system and those acquired from microscopic examination three stations (stations 6, 17 and 28) were selected for detailed manual analysis.
Table 1 shows the differences between counts for plankton abundances obtained by semi-automatic PIA and by 1/30th manual sub-sampling using a stempel pipette. There are two things to note, the first is that neither are error free. The LiZa camera system deployed in AMT21 had a limited depth of field that resulted in approximately 5% of images being of poor quality and out of focus (note: that the ratio of blurred to total count in table 1 cannot be used in this ratio calculation, as pump artefacts are not shown in the total). Secondly, manual sorting results in a higher quality set of data from the microscopy, but the sub-sampling technique adds noise to the final corrected sample abundance values. This a higher impact on rare categories, and in situations where the sample is not fully mixed, just prior to pipette sub sampling, to guarantee an even distribution of taxa across the sample volume. For example, eight chaetognaths were counted in this subsample; a change of just one to the inspected total would result in a ±12.5% change in sample abundance at 240 ± 30. The total counts of chaetognaths in both PIA and manual are within 10%, as are most categories, with the exception of eggs, ostracods and specific small copepod abundances.
In the PIA analysis, it is possible that some blurred bubble artefacts are actually eggs and ostracods, but both PIA and the validate could not perceive a difference. This will be resolved in the revised and improved imaging system. Copepod abundance differences are probably due to 3D pose issues with the camera system as the specimens are free to rotate in three dimensions as they pass through the flow cell. Many of the blurred images that were not rejected as artefacts were probably copepoda. At the magnification used in normal plankton analysis any single filaments of Trichodesmium spp. were difficult to count.
The unclassified category was also difficult to count because of the size range (protozoa to large coelenterates and chaetognaths) and large variation in morphologies. Certainly given more analysis time individual species of Pteropods, Isopoda, Decapods, Euphausiids, Chaetognaths, Tomopteris sp., Polychaeta, Salps, Fish larvae Dinoflagellates and Foraminfera could have been identified as well as more detailed identification of the larger copepods. The PIA analysis gives the counts of the large copepods but even cursory examination under the microscope reveals the obvious species like Pleuromammaxiphias, Giesbrecht (1889) and Euchaeta marina, Prestandrea (1833) both typical species of the temperate Atlantic Ocean.
Station 23 shows increased discrepancy between machine and human abundance counts. This is in part is due to the Chaetognaths, eggs and nauplii having low raw counts. Poor sub-sampling could also account for the differences in abundance of the other categories. In the PIA analysis the copepod counts could be increased by re-allocating many of the blurred counts to copepoda categories, since many, from their outline, were identifiable as putative copepods.
A similar trend of over estimation using sub-sampling is seen in station 23 where the total count of specimens was nine times the PIA count. Since all the particles in the sample were imaged using LiZa and then analyzed by PIA it is unlikely that specimen counts errors could be large because all the images were expert validated.
The counts of detritus using LiZa/PIA analysis for the three net hauls was 2580, 591 and 702 respectively. No comparison was available from the manual inspection method as the detritus flocculates making volumetric measurements impossible.
Table 1: Comparison of PIA validated abundances with manual sub-sampled abundances for sample AMT21 2011-10-07/0526 at station 6 at 33.484°N, 28.788°W; AMT21 2011-10-18/0621 at station 17 at 7.5°N, 27.775°W and AMT21 2011-1-29/0554 at station 28 at 23.102°S, 25.051°W.
| Sample | 2011-10-07/0526 (6) | 2011-10-18/0621 (17) | 2011-10-29/0554 (28) | |||||||
|---|---|---|---|---|---|---|---|---|---|---|
| Category | PIA | Manual (raw) | Manual (x30) | PIA | Manual (raw) | Manual (x30) | PIA | Manual (raw) | Manual (x30) | |
| Blurred | 969 | - | - | 1052 | 0 | 0 | 186 | 0 | 0 | |
| Chaetognath | 197 | 8 | 240 | 44 | 5 | 150 | 14 | 05 | 150 | |
| eggs | 34 | 25 | 750 | 10 | 6 | 180 | 4 | 3 | 90 | |
| nauplii | 47 | 0 | 0 | 25 | 2 | 60 | 7 | 00 | - | |
| Ostracod | 162 | 17 | 510 | 65 | 14 | 420 | 21 | 8 | 240 | |
| Trichodesmium | 462 | 0 | 0 | 161 | 0 | 0 | 32 | 0 | 0 | |
| unclassified | 1498 | 43 | 1290 | 1467 | 52 | 1590 | 295 | 48 | 1440 | |
| Large Copepod | 859 | 25 | 750 | 933 | 61 | 1830 | 195 | 33 | 990 | |
| Calanoid | 2699 | 82 | 2460 | 1673 | 133 | 3990 | 522 | 91 | 990 | |
| Cyclopoid | 235 | 49 | 1470 | 98 | 25 | 750 | 29 | 22 | 660 | |
| Harpactacoid | 454 | 63 | 1890 | 362 | 61 | 1830 | 10 | 17 | 510 | |
| Total count | 4228 | 312 | 9360 | 3757 | 360 | 10800 | 754 | 227 | 6810 | |
Discussion
The equipment and methodology illustrated here has been designed to minimize the human effort required to perform arduous sorting tasks. This is against a background of declining human resource for ocean studies. In the context of running this instrument as a ferry-box, the manual inspection can be done either during the cruise or post cruise. Potentially the LiZa/PIA system can image and sort the meso-plankton either from a pumped water source at up to 1,000 liters per hour or from net hauls in minutes.
Contrast this against analysing samples manually, where it is normal to subsample a net haul to count approximately 200 specimens (optimally repeated three times). It is reasonable to expect no more than three net hauls can be analysed in this way in one sitting. Ideally then 600 specimens per net haul could be inspected manually, totaling 1800 specimens in one day. Contrast this to Liza/PIA where no subsampling was performed on the images on the AMT cruise, so everything in the in-flow water stream was imaged and allocated a category. The number of specimens in one transect sample ranged from 745 to 84,000 specimen images. Approximately 474 cubic meters of water were imaged and all particles were labeled. The machine took from minutes to a few hours to analyse these images, and the expert validation took from 20 minutes to hours.
The errors of routine manual net analysis sub sampling are well described, but constitute the norm for net haul analysis. The sub-sample could comprise 1/5th to 1/40th of the sample and low occurrence taxa would be under-reported. The result of the semi-automatic methodology adopted here results in a ‘polished’ data set that is essentially error-free. The PIA/LiZA processing of the entire AMT21 net samples volume of 1901 m3 should give rare taxa more representation, being archived in the ‘unclassified’ category (Figure. 13), and thus amenable to further inspection and sorting with appropriate expertise.
An issue is that most of the pteropods and heteropods were juvenile many of the larger specimens were being damaged as were the larger decapods and coelenterates by the pumping system onboard. A review of the hydro dynamics of the cruise water inlet and pumping system is required.
In an attempt to further validate and disseminate the results of this study we are contacting all specialist groups to offer them access to the sorted, validated datasets.
Conclusion
Results compare favorably with earlier published data for small copepod abundance. The effort required to complete the AMT 21 data analysis to the level reported here is tractable and should allow ecological data to be extracted from net hauls and in-flow pumping within a week of the specimen images being available. This is more than a factor of ten faster than is currently possible using purely human effort alone. It is presented as a way of collecting biological samples that is faster, higher volume and at a greatly reduced cost to an entirely manual process. In addition archived image data takes up less space and is more durable than preserved specimen collections.
This instrument offers a technique for the inclusion of biological sampling in ferry box systems. It cannot replace the human expertise of the CPR survey, but can increase the frequency of sampling and the volume of seawater analysed for mesoplankton. A semi-automatic methodology has be presented that solves, in part, the issue of low abundance taxa through sampling one cubic meter of water per hour and allowing experts to view a partially sorted image set to validate the taxa present in the sample.
The increased spatial and temporal scale of PIA/LiZA sampling will provide more data for ocean ecology science in the future. Synchronising PIA/LiZA analysed data with physical chemical measurements will add to the richness of measurements taken and will improve ecological models.
Acknowledge:
This work was carried out under the remit of Scientific Committee on Oceanic Research (SCOR) Working Group 130 for automatic plankton identification. We acknowledge the support SCOR provided to make this study possible.
We wish to thank the officers and crew of the Natural Environment Research Council’s research ship RRS ‘Discovery’ for their valuable help during AMT 21 cruise.
References
- 1. Bottger-Schnack, R., Schnack, D. Vertical distribution and population structure of Macrosetella gracilis (Copepoda: Harpacticoida) in the Red Sea in relation to the occurrence of Oscillatoria (Trichodesmium spp.) (cyanobacteria). (1989) Mar Ecol Prog Ser 52: 17-31.
- 2. Calef, G.W., Grice, G.D. Relationship between the Blue-Green Alga Trichodesmium thiebautii and the copepod Macrosetella gracilis in the plankton off Northeastern South America. (1966) Ecology 47(5): 855-856.
- 3. Culverhouse, P.F., Williams, R., Gallienne, C., et al. An Instrument for Rapid Meso-zooplankton Monitoring at Ocean Basin Scale. (2015) J Marine Biol Aquacult 1(1): 1-11.
- 4. Dubelaar, G.B.J., Gerritzen, P.L. CytoBuoy: a step forward towards using flow cytometry in operational oceanography. (2000) Scientia Marina 64(2): 255-265.
- 5. Gallienne, C.P., Robins, D.B. Is Oithona the most important Copepod in the world's oceans? (2001) J Plank Res 23(12):1421-1432.
- 6. Gallienne, C.P., Robins, D.B., Wood-Walker, R.S. Abundance, distribution and size structure of zooplankton along a 20° west meridional transect of the northeast Atlantic Ocean in July. (2001) Deep Sea Res Part II: Topical Studies in Oceanography 48(4-5): 925-949.
- 7. Glover, R.S. The Continuous Plankton Recorder survey of the North Atlantic. (1967) Symp Zool Soc London 19:189–210
- 8. Gorsky, G., Ohman, M.D., Picheral, M., et al. Digital zooplankton image analysis using the Zoo Scan integrated system. (2010) J Plank Res 32(3): 285-303.
- 9. Kaitala, S., Kettunen, J., Seppälä, J. Introduction to Special Issue: 5th ferrybox workshop — Celebrating 20 years of the Alg@line. (2014).
- 10. O'Neil, J.M. The colonial cyanobacterium Trichodesmium as a physical and nutritional substrate for the harpacticoid copepod Macrosetella gracilis. (1998) J Plank Res 20(1): 43-59.
- 11. O'Neil, J.M., Roman, M.R. Grazers and associated organisms of Trichodesmium. In E. J. Carpenter, et al. [eds.], Marine Pelagic Cyanobacteria: Trichodesmium and other Diazotrophs. (1992) Kluwer Academic Publishers 61-73.
- 12. Robinson, C., Holligan, P., Jickells, T.D., et al. The Atlantic Meridional Transect programme (1995-2012): Foreword. (2009) Deep-Sea Res II 56: 895-898.
- 13. Rutten, T., Dubelaar, G. A CytoSense in a Ferrybox adds information and saves sensors. (2015)
- 14. Sato, M., Dower, J., Kunze, E., et al. Second-order seasonal variability in diel vertical migration timing of euphausiids in a coastal inlet. (2013) Mar Ecol Prog Ser 480: 39-56.
- 15. Wolfenden, R.N. Die marinen Copepoden der Deutschen Südpolar Expedition 1901-1902. II. Die pelagischen Copepoden der Westwind drift und des südlichen Eismeers met Beschrei bungmehrererneuer Artenausdem Atlantischen Ozean. Dt. Südpol. -Exped. 1911. 12 (Zool. 4): 181-380.


