QSAR modeling useful in anti-cancer drug discovery: Prediction of V600EBRAF-dependent p-ERK using Monte Carlo Method
Khalid Bouhedjar
Affiliation
- 1Laboratoire de Sécurité Environnementale et Alimentaire, Université Badji Mokhtar Annaba, B.P. 12, 23000 Annaba, Alegria
- 2Centre de Recherche en Biotechnologie, Ali Mendjli Nouvelle Ville UV 03, B.P. E73, 25016, Constantine, Alegria
- 3Istituto di Ricerche Farmacologiche Mario Negri, Via La Masa 19, 20156 Milano, Italy
- 4Department of Electronics and Information, Politecnico di Milano, Via Ponzio 34/5, 20133 Milano, Italy
Corresponding Author
K, Bouhedjar. Centre de Recherche en Biotechnologie, Ali Mendjli Nouvelle Ville UV 03, B.P. E73, 25016, Constantine, Alegria; Tel: +21331775044; E-mail: khalid.bouhedjar@univ-annaba.org
Citation
K, Bouhedjar., et al. QSAR Modeling useful in Anti-Cancer Drug Discovery: Prediction of V600EBRAF-Dependent P-ERK using Monte Carlo Method. (2017) J Med Chem Toxicol 2(1): 34-39.
Copy rights
© 2017 K, Bouhedjar. This is an Open access article distributed under the terms of Creative Commons Attribution 4.0 International License.
Keywords
QSAR; Kinase inhibitors; Monte carlo method; Sorafenib; Smiles
Abstract
Quantitative structure−activity relationship (QSAR) modeling is one of the major computer aided modeling employed in medicinal chemistry. It is used for developing relationships between the effects (e.g. activities and properties of interest) of a series of molecules with their structural properties. The aim of this work was to develop QSAR models to predict the inhibition of V600EBRAF-dependent extracellular regulated kinase (ERK) phosphorylation in WM266.4 melanoma cell lines (IC50p ERK) using the CORAL software (http://www.insilico.eu/coral). These models make use of descriptors based on simplified molecular input-line entry system (SMILES), optimized with the Monte Carlo method. The statistical quality of the newly built models was satisfactory on three random splits of data.
Introduction
Mitogen-activated protein kinase (MAPK) modulates extracellular signals to control several cell functions (from proliferation and survival to differentiation and senescence)[1,2]. One of the most studied MAPK pathways is the extracellular signal-regulated kinase (ERK) pathway. ERK is a subgroup of MAPKs that is activated by external factors such as growth factors and mitogens[3]. The cascade of ERK signalling is triggered by the activation of receptor tyrosine kinases and flows through RAS GTPase[4]. RAF kinases are key components of this pathway: once RAS is turned on, it recruits and activates proteins necessary for the propagation of growth factor and other receptor signals, such as RAF. There are three RAF proteins in mammals, ARAF, BRAF, and CRAF, and they can all activate MAP kinase (MEK) just upstream of ERK[5]. The over-expression or mutations of the components of the RAS–RAF–MEK–ERK–MAP kinase pathway has been found to occur in up to 30 % of human cancers[6]. In different cancer types, the mutation of RAS or RAF causes the hyper activation of ERK followed by unrepresents a potential approach for the treatment of cancer[8]. In particular, BRAF somatic missense mutations have been found to occur in 66% of malignant melanomas and at lower frequency in a wide range of human cancers[5,9].
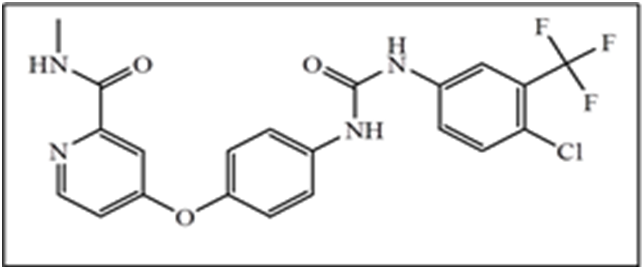
Among the BRAF mutations, a point mutation resulting in substitution of glutamic acid for valine, also known as BRAFV600E, is the most common change[6]. In the recent past, a number of small molecules inhibiting mutant RAF kinases have been discovered, and some of these have now advanced into clinical trials. For example, Sorafenib[10] (Figure 1) is the most studied inhibitor for this class of kinases. It was approved by FDA in 2005 for the treatment of renal cell carcinoma and in 2007 for the treatment of hepatocellular carcinoma, and is still undergoing multiple clinical trials in other types of cancer[11,12].
Figure 1: Structures of Sorafenib (Bay 43-9006; Nexavar).
The experimental measurement of the inhibition activity of chemicals is difficult, expensive and time-consuming. QSAR based analysis can be used as a tool to screen or filter anti-cancer drug candidates, before they are subjected to more intensive calculations, such as docking, or to experimental in vitro measurement of activity and finally under in vivo conditions[13]. In this study, a model was built to predict the half maximal inhibitory concentration (IC50) of V600EBRAF-dependent ERK phosphorylation in WM266.4 cells. This model made use of descriptors based on simplified molecular input-line entry system (SMILES)[14-17], calculated with the CORAL software. Then, chemical information obtained from the calculation of these descriptors was used for drawing up hypothesis of molecular design of Sorafenib derivatives.
The aim was to obtain molecules able to inhibit 50% of ERK phosphorylation in WM266.4 melanoma cells at lower concentrations compared to the template molecule.
Methods
Data
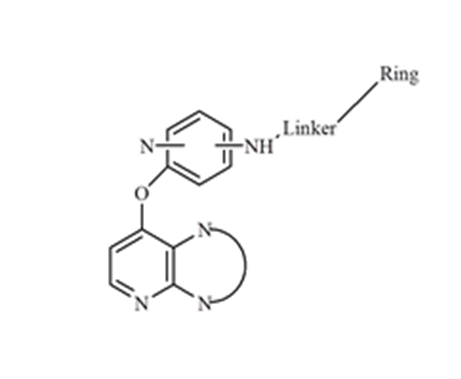
The dataset of 142 chemical structures used in this study was taken from the literature[18,19]. All these compounds shared a common scaffold (Figure 2). The dataset contained chemical structures represented as SMILES strings, and experimental values relative to the inhibition of the phosphorylation of extracellular signal-regulated kinases (p-ERK).
Figure 2: General structure of target series.
The selected endpoint was IC50 of V600EBRAF-dependent[20] ERK phosphorylation in WM266.4 melanoma cells (IC50, pERK)[1,14]. IC50 values were expressed as negative decimal logarithm (pIC50). In this study ACD ⁄ ChemSketch[21], was used to build up SMILES of each structure.
CORAL and Optimal descriptors
CORAL is freely available standalone application software for building up regression or classification QSAR models based on the Monte Carlo technique[22]. The calculations are repeated several times for various splits into training, calibration and external validation sets. Optimal descriptors for constructing QSAR models are based on graph or SMILES. The molecular graph includes hydrogen suppressed graph (HSG), hydrogen filled graph (HFG), and graph of atomic orbital’s (GAO).
The SMILES-based optimal descriptors include a group of local and one of global attributes. Sk, SSk, and SSSk are local descriptors represented by a sequence of atoms and bonds present in the SMILES string[23].
The SMILES “ClCCCBr”, Sk, SSk, and SSSk can be represented as follows:
ClCCCBr → Cl + C + C + C + Br ( Sk )
ClCCCBr → ClC + CC + CC + CBr( SSk )
ClCCCBr → ClCC +CCC+ CCBr( SSSk )
BOND, PAIR, NOSP and HALO are global SMILES attributes, involving the presence of the following specific items in the target SMILES:
BOND refers to the presence/absence of double (=), triple (#), and stereo chemical (@) bonds;
PAIR indicates the co-occurrence of two elements among the followings: F, Cl, Br, I, N, O, S, P, #, =, @;
NOSP indicates the presence/absence of nitrogen, oxygen, sulfur, and phosphorus;
HALO refers to the presence/absence of halogens.
A more detailed explanation of CORAL descriptors has been provided by[24]. All the SMILES-based local descriptors and BOND, NOSP and HALO global attributes were selected to build the regression models.
Table 1: The statistical characteristics of QSAR model of pIC50 p-ERK inhibitors.
| Set | n | r² | q² | s | MAE | F | CRp² | T | N |
|---|---|---|---|---|---|---|---|---|---|
| Split 1 | |||||||||
| Training | 86 | 0.90 | 0.91 | 0.371 | 0.289 | 743 | 0.89 | 3 | 3 |
| Calibration | 28 | 0.83 | 0.80 | 0.481 | 0.356 | 126 | 0.80 | ||
| Validation | 28 | 0.87 | 0.392 | 0.2945 | 170 | ||||
| Split 2 | |||||||||
| Training | 86 | 0.90 | 0.90 | 0.364 | 0.279 | 777 | 0.90 | 5 | 4 |
| Calibration | 28 | 0.78 | 0.75 | 0.448 | 0.348 | 96 | 0.75 | ||
| Validation | 28 | 0.89 | 0.393 | 0.312 | 205 | ||||
| Split 3 | |||||||||
| Training | 86 | 0.92 | 0.92 | 0.293 | 0.219 | 810 | 0.92 | 2 | 6 |
| Calibration | 28 | 0.89 | 0.87 | 0.385 | 0.321 | 207 | 0.87 | ||
| Validation | 28 | 0.86 | 0.501 | 0.3459 | 155 | ||||
Data were randomly split three times into training (60%), calibration (20%) and validation sets (21%). Table 1 The training and calibration sets were used for building the QSAR model and the validation set was used as external set for estimating the predictive potential of the developed model[25]. In order to develop a model with a good predictive potential, the preferable parameters of the Monte Carlo optimization, the threshold (T*) and the number of epochs (N*) that give the best statistics for the calibration set should be defined.
The threshold is a tool for classifying codes as both rare (and thus likely less reliable features, probably introducing noise into the model) and common features, which are used by the model and labelled as active. The optimal descriptors are calculated with the correlation weights (CW) only of active features, excluding those related to rare ones.
The Nepoch is the number of cycles (sequence of modifications of correlation weights for all codes involved in model development) for the optimization[26]. For modelling activity of potential p-ERK inhibitors the descriptor of correlation weights (DCW) was calculated as follows:
DCW (Threshold, Nepoch) = Σ CW (Sk) + Σ CW (SSk) + Σ CW (SSSk) + Σ CW (BOND) + Σ CW (HALO) + Σ CW (NOSP) (1)
where CW(SAk) is correlation weight for a molecular or structural feature (SAk) extracted from k-th SMILES;
The endpoint pIC50 is a function of DCW according to the following equation:
Endpoint = C0 + C1 x DCW (T, Nepoch) (2)
Where C0 and C1 are the intercept and the slope for the training and calibration set, respectively.
The role of molecular features or structural attributes (SAk) extracted by SMILES can be defined by the value of CWs: SAk with positive CW are promoters of pIC50; SAk with negative CWs are responsible for the endpoint decrease; if there are both positive and negative values of CW (Sk), then that SAk has an undefined role. The applicability domain of the models can be defined according to the distribution of the molecular attributes extracted from the k-th SMILES.
A SMILES falls into the applicability domain if the following condition occurs:
Defect SMILES < 2* (Defect SMILES)̅ (3)
Where Defect SMILES is the measure of the statistical (probabilistic) quality of molecular features extracted from k-th SMILES, and (Defect SMILES)̅ is the average of these values for the training and calibration sets. Defect SMILES is calculated as follows:
Defect SMILES = Σ≣ {Defect({SA}_k)} (4)
Defect ({SA}_k) = |P_(TRN(SAk)-) P_TST(SAk) |/(N_(TRN(- SAk)+) N_TST(SAk) ) (5)
Where PTRN (SAk) is the probability of the presence of SAk in the SMILES of the training set and PTST (SAk) is the probability of SAk in the SMILES of the calibration set. NTRN (SAk) is the number (frequency) of SMILES containing SAk in the training set and NTST (SAk) is the number of SMILES containing SAk in the calibration set. The ideal situation occurs when the probabilities of SAk are the same in the training and in the calibration sets (Defect (SAk) is equal to zero). Conversely, if SAk is absent in the calibration set, the Defect (SAk) is maximal. Thus, the results from equation (4) can be used to classify the active attributes, and the Defect SMILES defines the domain of applicability for SMILES[26].
Results and Discussion
The models for three random splits are the following:
Split 01 pIC50 = 1.4942 (± 0.0237) + 0.0379 (± 0.0001) * DCW (3, 3) (07)
Split 02 pIC50 = -1.0822 (± 0.0222) + 0.0342 (± 0.0001) * DCW (5, 4) (08)
Split 03 pIC50 = -1.8219 (± 0.0236) + 0.05103 (± 0.0002) * DCW (2, 6) (09)
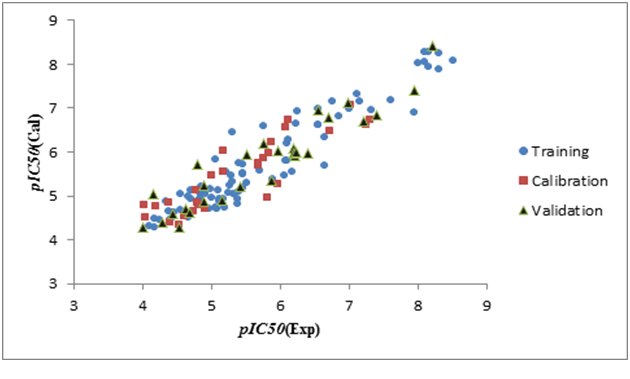
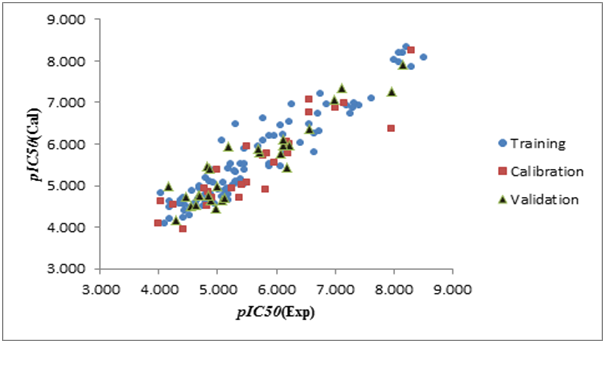
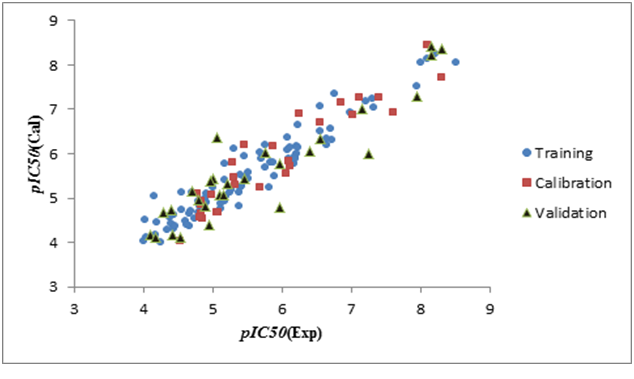
Figure 3(a), Figure 3(b), Figure 3(c) shown a graphs plotting of the calculated versus experimental pIC50 values.
Figure 3a: Graphical representation of built QSAR model for split 01.
Figure 3b: Graphical representation of built QSAR model for split 02.
Figure 3c: Graphical representation of built QSAR model for split 03.
The values of the parameters of statistical analysis of p-ERK inhibition models built on the three random distributions of data into training, calibration, and validation sets are collected in Table 2. n is the number of compounds in each set; r² is the coefficient of determination; q² is cross validated r²; MAE is mean absolute error; s is the root-mean-square error; F is the Fischer F ratio; T and N are the preferable values for Threshold and Number of epochs, respectively. CR_p^2 indicates if the models developed are obtained by chance or not, based on the Y-randomization test. For an acceptable model, CR_p^2 should be greater than 0.5[27,28]. r² range from 0.78 to 0.92, and q² range from 0.75 to 0.92 (for training, calibration and test sets). According to the criteria defined by Tropsha[26-29], a model has high predictive power if the following conditions are fulfilled:
q² > 0.5
r² > 0.6
(r² - r²0)/r² < 0.1 or (r² - r′0²)/r² < 0.1
0.85 ≤ k ≤ 1.15 or 0.85 ≤ k′ ≤ 1.15
|r0²−r′0²| < 0.3
Where r0² and r′0² are squared correlation coefficients for regression through the origin, calculated between predicted versus experimental values and between experimental versus predicted values, k and k′ are the slopes in the former and later cases respectively; q² is calculated for the training sets, while all other criteria are calculated for the validation sets[26]. Table 3 contains the values for the criteria iii, iv, and v. Y-randomization test for all models showed that these are not chance correlations, since the CR_p^2 is larger than 0.5 (Table 2). All the models successfully fulfill the criteria proposed by Tropsha for predictive ability. 86 out of 142 dataset’s compounds assigned to the training set are used to develop the QSAR models, 28 compounds are included in the calibration, and 28 compounds, not involved in the model development, are kept out for the external validation. Based on r² and q² values, the three models of equations (07), (08) and (09) have similar statistical behaviours. Indicating that the random selection does not affect the results. The predictability of the models was also checked calculating the statistical parameters rm², average rm², and Δrm² on the calibration sets (Table 3), as proposed in the literature[29,30]. According to the literature, a model has predictive potential if rm² > 0.5, average rm² > 0.5, and Δrm² < 0.2[31]. The presented results reveal that the predict ability of all models is very good, especially for the model of equation (09), with q² and rm² values equal to e 0.92 and 0.88, respectively (Table 3).
Table 2: The numerical values of (r²-r′0²)/r²; (r²- r0²)/r²; k; k′ and |r0² – r′0²|.
| Split | (r²-r0²)/r² | r²-r′0²)/r² | |r0² – r′0²| | k | k′ |
|---|---|---|---|---|---|
| 1 | 0.0244 | 0.0000 | 0.0000 | 0.9909 | 1.0045 |
| 2 | 0.0320 | 0.0021 | 0.0018 | 0.9966 | 0.9991 |
| 3 | 0.0136 | 0.0017 | 0.0014 | 0.9878 | 1.0051 |
Table 3: The numerical values of rm²; (rm²)̅; Δrm².
| Split | rm² | (rm²)̅; | Δrm² |
|---|---|---|---|
| 1 | 0.7239 | 0.7547 | 0.0615 |
| 2 | 0.5770 | 0.6729 | 0.1919 |
| 3 | 0.8768 | 0.8372 | 0.0791 |
The list of all SAk, with the correlation weights for the three splits from the Monte Carlo optimization process of the built QSAR model is given in Table S2, S3 and S4. Based on the best model in validation obtained from split 2, some SMILES based descriptors have positive influence on pIC50 and therefore cause an increase of pIC50 value[32-35]. : =........... (Molecule containing double bond), N........... (Molecule contains nitrogen atom), O........... (Molecule containing oxygen atom), c...O....... (Molecule contains oxygen atom bonded to aromatic carbon atom), c...N....... (Molecule containing nitrogen atom bonded to aromatic carbon atom), c...S....... (Molecule containing sulfur atom bonded to aromatic carbon atom), Cl.......... (Molecule containing chlorine atom), BOND10000000: (molecule contains fluorine atom) etc.
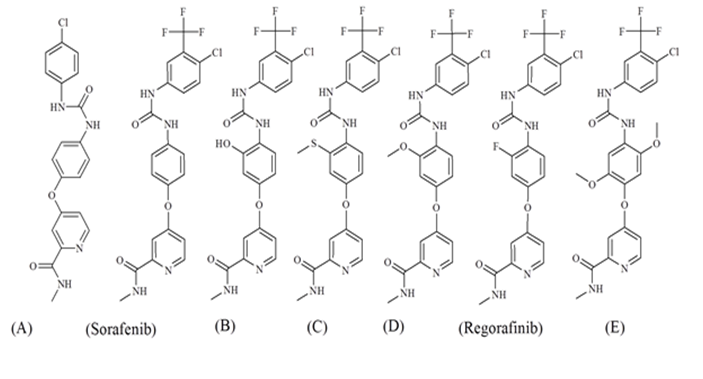
The mechanistic interpretation obtained from the analysis of SAk can be used in the search and computer aided design of novel p-ERK inhibitors candidates with desired pIC50 values. Figure 4 shows the structures of proposed kinase inhibitors derivatives, the structure Sorafenib was used as a template for molecular design by added the SMILES notation c...S......., BOND10000000 and c...O....... defined as promoters of increase. The molecule E has a higher value of pIC50 in comparison to other molecules.
Figure 4: The molecular design of possible kinase inhibitors using the QSAR model of split 2 and SAks calculated using the Monte Carlo method
Table 4: SMILES notation and pIC50 values calculated by using model of split 2 for kinase inhibitors derivatives designed by using the results of QSAR model obtained in this study.
| Molecules | SMILES notation | pIC50 (Expr.) |
pIC50 (calc.) |
|---|---|---|---|
| A | CNC(=O)C1=CC(OC2=CC=C(NC(=O)NC3=CC=C(Cl)C=C3)C=C2)=CC=N1 | / | 4.85 |
| Sorafenib | CNC(=O)C1=CC(OC2=CC=C(NC(=O)NC3=CC(=C(Cl)C=C3)C(F)(F)F)C=C2)=CC=N1 | 5.585 | 5.3407 |
| B | CNC(=O)C1=CC(OC2=CC(O)=C(NC(=O)NC3=CC(=C(Cl)C=C3)C(F)(F)F)C=C2)=CC=N1 | / | 5.6258 |
| C | CNC(=O)C1=CC(OC2=CC(SC)=C(NC(=O)NC3=CC(=C(Cl)C=C3)C(F)(F)F)C=C2)=CC=N1 | / | 5.9108 |
| D | CNC(=O)C1=CC(OC2=CC(OC)=C(NC(=O)NC3=CC(=C(Cl)C=C3)C(F)(F)F)C=C2)=CC=N1 | / | 5.9694 |
| Regorafinib | CNC(=O)C1=CC(OC2=CC(F)=C(NC(=O)NC3=CC(=C(Cl)C=C3)C(F)(F)F)C=C2)=CC=N1 | / | 5.9965 |
| E | CNC(=O)C1=CC(OC2=C(OC)C=C(NC(=O)NC3=CC(=C(Cl)C=C3)C(F)(F)F)C(OC)=C2)=CC=N1 | / | 6.5764 |
Supplementary materials section contains technical details of the models for splits examined in this work.
Conclusion
In this work three QSAR models were developed to predict V600EBRAF-dependent ERK phosphorylation of 142 molecules as kinase inhibitors, using SMILES based optimal descriptors. The models showed acceptable predictive capability on three random split of data. The analysis of the structural features (obtained from SMILES) with their positive and negative correlation weights allowed designing possible pERK inhibitors with an increased activity compared to Surafenib.
The activity modulating effect of the structural features may serve to draw up preliminary hypothesis of novel anticancer drug candidates, and also to provide a better understanding the drugs mechanisms of action.
Acknowledge:
This research has been partially done during a research visit of the Corresponding author to Politecnico di Milano and Mario Negri Institute in Italy, in the PROSIL Life + research project of the European Union (LIFE12 ENV/IT/000154).
Conflict of interest:
The authors have no conflict of interest to declare.
Supplementary material
Table S1. Experimental and calculated of pIC50 p-ERK inhibitors for three splits; training (Tr); calibration (C); and validation (V) sets.
Table S2. Correlation weights for DCW calculation for split 1; obtained in three probes of the Monte Carlo optimization.
Table S3. Correlation weights for DCW calculation for split 2; obtained in three probes of the Monte Carlo optimization.
Table S4. Correlation weights for DCW calculation for split 3; obtained in three probes of the Monte Carlo optimization.
References
- 1. Wolin, R.L., Bembenek, S.D., Wei, J. et al. Dual binding site inhibitors of B-RAF kinase. (2008) Bioorg Med Chem Lett. 18(9): 2825–2829.
Pubmed || Crossref - 2. Niculescu-Duvaz, D., Gaulon, C., Dijkstra, H.P. et al. Pyridoimidazolones as Novel Potent Inhibitors of v-Raf Murine Sarcoma Viral Oncogene Homologue B1 (BRAF). (2009) J Med Chem 52(8): 2255–2264.
Pubmed || Crossref - 3. Hansen, J.D., Grina, J., Newhouse, B. Et al. Potent and selective pyrazole-based inhibitors of B-Raf kinase. (2008) Bioorg Med Chem Let 18(16): 4692–4695.
Pubmed || Crossref - 4. Mitin, N., Rossman, K.L., Der, C.J. Signaling interplay in Ras super family function. (2005) Cur Bio 15(14): 563–574.
Pubmed || Crossref - 5. Davies, H., Bignell, G.R., Cox, C. et al. Mutations of the BRAF gene in human cancer. (2002) Nature 417(6892): 949–954.
Pubmed || Crossref - 6. Whittaker, S., Ménard, D., Kirk, R. et al. A novel, selective, and efficacious nanomolar pyridopyrazinone inhibitor of V600EBRAF. (2010) Cancer Res 70(20): 8036–8044.
Pubmed || Crossref - 7. Hommes, D.W. Mitogen activated protein (MAP) kinase signal transduction pathways and novel anti-inflammatory targets. (2003) Gut 52(1): 144–151.
Pubmed || Crossref - 8. Ohori, M., Kinoshita, T., Okubo, M. Identification of a selective ERK inhibitor and structural determination of the inhibitor-ERK2 complex. (2005) Biochem Biophys Res Commun 336(1): 357–363.
Pubmed || Crossref - 9. Oikonomou, E., Koustas, E., Goulielmaki, M. et al. BRAF vs RAS oncogenes: Are mutations of the same pathway equal? Differential signalling and therapeutic implications. (2014) Oncotarget 5(23): 11752–11777.
Pubmed || Crossref - 10. Eisen, T., Ahmad, T., Flaherty, K.T. et al. Sorafenib in advanced melanoma: a Phase II randomised discontinuation trial analysis. (2006) Br J Cancer 95(5): 581–586.
Pubmed || Crossref - 11. Lowinger, T.B., Riedl, B., Dumas, J. et al. Design and Discovery of Small Molecules Targeting raf-1 Kinase. (2002) Cur Pharm Des 8(25): 2269–2278.
Pubmed || Crossref - 12. Dietrich, J., Gokhale, V., Wang, X. et al. Application of a novel [3+2] cycloaddition reaction to prepare substituted imidazoles and their use in the design of potent DFG-out allosteric B-Raf inhibitors. (2010) Bioorg Med Chem 18(1): 292–304.
Pubmed || Crossref - 13. Malik, A., Singh, H., Andrabi, M. et al. Databases and QSAR for cancer research. (2006) Cancer Inform. 2: 99–111.
Pubmed - 14. Toropov, A. A., Toropova, A.P., Benfenati, E. Simplified molecular input line entry system-based optimal descriptors: Quantitative structure-activity relationship modeling mutageni city of nitrated polycyclic aromatic hydrocarbons. (2009) Chem Bio Drug Des 73(5): 515–625.
Pubmed || Crossref - 15. Weininger, D., Weininger, A., Weininger, J.L. SMILES. 2. Algorithm for generation of unique SMILES notation. (1989) J Chem Inf Model 29(2): 97–101.
Crossref - 16. Weininger D. SMILES, a chemical language and information system. 1. Introduction to methodology and encoding rules. (1988) J Chem Inf Model 28(1): 31–36.
- 17. Toropov, A.A., Toropova, A.P., Martyanov, S.E. et al. Comparison of SMILES and molecular graphs as the representation of the molecular structure for QSAR analysis for mutagenic potential of polyaromatic amines. (2011) Chemo Intel Lab Sys 109(1): 94–100.
Crossref - 18. Zambon, A., Ménard, D., Suijkerbuijk, B.M., JM, et al. Novel hinge binder improves activity and pharmacokinetic properties of BRAF inhibitors. (2010) J Med Chem 53(15): 5639–5655.
Pubmed || Crossref - 19. Nourry, A., Zambon, A., Davies, L. et al. BRAF inhibitors based on an imidazo[4,5]pyridin-2-one scaffold and a meta substituted middle ring. (2010) J Med Chem 53(5): 1964–1978.
Pubmed || Crossref - 20. Menard, D., Niculescu-Duvaz, I., Dijkstra, H.P, et al. Novel potent BRAF inhibitors: Toward 1 nM compounds through optimization of the central phenyl ring. (2009) J Med Chem 52(13): 3881–3891.
Pubmed || Crossref - 21. ACD/Chem Sketch Freeware. (2015).
- 22. Toropova, A.P., Toropov, A.A., Benfenati, E. CORAL: Prediction of binding affinity and efficacy of thyroid hormone receptor ligands. (2015) Eur J Med Chem 101: 452–461.
Pubmed || Crossref - 23. Prachayasittikul, V., Worachartcheewan, A., Toropova, A.P. et al. Large-scale classification of P-glycoprotein inhibitors using SMILES-based descriptors. (2017) SAR QSAR Environ Res 28(1): 1–16.
Pubmed || Crossref - 24. Manganelli, S., Benfenati, E., Manganaro, A. et al. New Quantitative Structure–Activity Relationship Models Improve Predictability of Ames Mutagen city for Aromatic Azo Compounds. (2016) Toxicol Sci 153(2): 316–326.
Pubmed || Crossref - 25. Tropsha, A. Best Practices for QSAR model development, validation, and Exploitation. (2010) Mol Inform. 29(6–7): 476–488.
Pubmed || Crossref - 26. Manganelli, S., Leone, C., Toropov, A.A. Toropova AP, Benfenati E. QSAR model for predicting cell viability of human embryonic kidney cells exposed to SiO2 nanoparticles. (2016) Chemosphere 144: 995–1001.
Pubmed || Crossref - 27. Ojha, P.K., Roy, K., Comparative QSARs for ant malarial end chins: Importance of descriptor-thinning and noise reduction prior to feature selection. (2011) Chemo Intel Lab Sys 109(2): 146–161.
Crossref - 28. Tropsha, A., Gramatica, P., Gombar, V.K. The importance of being earnest: Validation is the absolute essential for successful application and interpretation of QSPR models. (2003) Qsar Comb Sci 22(1): 69–77.
Crossref - 29. Roy, P.P., Leonard, J.T., Roy, K. Exploring the impact of size of training sets for the development of predictive QSAR models. (2008) Chemo Intel Lab Sys 90(1): 31–42.
Crossref - 30. Roy, K., Mitra, I., Kar, S. et al. Comparative studies on some metrics for external validation of QSPR models. (2012) J Chem Inf Model 52(2): 396–408.
Pubmed || Crossref - 31. Roy, K., Chakraborty, P., Mitra, I. et al. Some case studies on application of “rm2” metrics for judging quality of quantitative structure-activity relationship predictions: Emphasis on scaling of response data. (2013) J Comput Chem. 34(12): 1071–1082.
Pubmed || Crossref - 32. Veselinovic, A.M., Milosavljevic, J.B., Toropov, A.A. et al. SMILES-Based QSAR models for the calcium channel-antagonistic effect of 1,4-dihydropyridines. (2013) Arch Pharm (Weinheim) 346(2): 134–139.
Pubmed || Crossref - 33. Veselinovic, A.M., Milosavljevic, J.B., Toropov, A.A. SMILES-based QSAR model for arylpiperazines as high-affinity 5-HT1A receptor ligands using CORAL. (2013) Eur J Pharm Sci 48(3): 532–541.
Pubmed || Crossref - 34. Veselinovic, J.B., Toropov, A.A., Toropova, A.P. et al. Monte Carlo Method-Based QSAR Modeling of Penicillin’s Binding to Human Serum Proteins. (2015) Arch Pharm (Weinheim) 348(1): 62–67.
Pubmed || Crossref - 35. Veselinovic A.M., Veselinovic, J.B., Toropov, A.A. et al. In silico prediction of the β-cyclodextrin complexation based on Monte Carlo method. (2015) Int J Pharm 495(1): 404–409.
Pubmed || Crossref


