Quality Implications of Physico-Chemical Properties and Heavy Metal Concentration Levels in Groundwater Sources in Elebele Community, Bayelsa State, Nigeria
Nwankwoala, H.O1* and Omemu, S.O2
Affiliation
1Deparrment of Geology, University of Port Harcourt, Nigeria
2Institute of Natural Resources, Environment and Sustainable Development, University of Port Harcourt, Nigeria
Corresponding Author
Nwankwoala, H.O, Deparrment of Geology, University of Port Harcourt, Nigeria; E-mail: nwankwoala_ho@yahoo.com
Citation
Nwankwoala, H.O., et al. Quality Implications of Physico-Chemical Properties and Heavy Metal Concentration Levels in Groundwater Sources in Elebele Community, Bayelsa State, Nigeria. (2019) J Environ Health Sci 5(1): 52-58.
Copy rights
© 2019 Nwankwoala, H.O. This is an Open access article distributed under the terms of Creative Commons Attribution 4.0 International License.
Keywords
Groundwater quality; Heavy metal; Physico-chemical properties; Elebele; Bayelsa state
Abstract
This study evaluated the physico-chemical properties and heavy metal concentration levels and quality implications in groundwater sources in Elebele Community in Ogbia Local Government Area of Bayelsa State, Nigeria. Standard sampling and analytical methods were employed. The physico-chemical properties of groundwater in the area measured are within permissible limits, except pH (6.4 – 6.56) and iron (0.35 – 12.14) which require treatment. All the heavy metals, except Co and Fe show values < 0.01mg/l. Some physico-chemical parameters measured in-situ and their concentration ranges are: conductivity (111.9-229.40 µS/cm), TDS (21.4-57.1, mg/l), temperature, (27.07-33.88oC), and pH (6.44-6.87). Metals analyzed include: Fe, Pb, Cu, Cr, Co, Mn, Ni, Zn and Cd. Results also revealed considerable amount of heavy metals in surface water, though the level were below WHO maximum permissible levels for Ni, zinc and Cr. In the groundwater, Fe and Pb exceeded the WHO maximum permissible limit (Fe = 0.3; Pb = 0.015). Based on the results, it is recommended that the government and other relevant agencies should monitor particularly the level of iron as well as other physico-chemical properties of water in the area.
Introduction
Water is a precious resource and is generally known as a standout amongst the most basic needs of man. Moreover, water is the most bounteous regular assets on the surface of the earth (Oyinloye and Jegede, 2004), while groundwater is the biggest reservoir of drinkable water. Because of natural filtration, it is less sullied when compared with surface water quality (Aiyesanmi et al., 2004). Unfortunately, quality of groundwater worldwide in its current state is being impaired by various anthropogenic activities (Ekpete, 2002).
Groundwater plays an important role for society, economy and ecology developments. It represents an important source of water used by humans as well as both industrial and agricultural activities in regions where surface water is scarce (Delgado et al. 2010). The demand for water has rapidly increased over the past few years and this has resulted in water scarcity in many parts of the world.Groundwater is a vital wellspring of water for horticultural and residential purposes particularly in third world countries like Nigeria, because of long maintenance time and normal filtration limit of aquifers. Notwithstanding, leachate from landfills are potential sources of pollution of both surface water and groundwater (Odukoya et al., 2002). The nearness of such contaminants to groundwater, the higher is the risk for the contaminants to exceed EPA, FEPA and WHO quality standards and consequently, adverse health impacts (USEPA, 2002).
The rapid increase of population associated with changing lifestyles has also increased the domestic, agricultural and industrial usage of groundwater in the study area, particularly in Elebele community. The contamination of these aquifers has also added another dimension to the problem for decision maker and politicians. To utilize and protect valuable water sources effectively and predict the change in groundwater environments, it isnecessary to understand the hydrochemical parameters of groundwater such as pH, electrical conductivity (EC), total dissolved solids (TDS), and total hardness (TH) (Guendouz et al., 2003; Edmunds et al., 2006; Prasanna et al., 2010; Raji et al., 2010). Water quality gets modified along the course of movement of water through the hydrological cycle and through the operation of the following processes: evaporation, transpiration, selective uptake by vegetation, oxidation/reduction, cation exchange, dissociation of minerals, precipitation of secondary minerals, mixing of waters, leaching of fertilizers and manure, pollution and biological processes (Appelo and Postma 2005).
Land use activities, among other factors, have, however, posed a threat to groundwater quality (Babiker et al., 2005). Often referred to as a “hidden resource”, groundwater is trapped beneath the ground surface, making it a bit difficult to be monitored relative to surface water. Groundwater is the major source of fresh water for drinking, irrigation, and other economic sectors (Nwankwoala et al., 2013). Groundwater reserves are being depleted due to numerous natural and anthropogenic causes. The physicochemical properties of water are influenced by the various natural factors (Yahoya et al., 2010). They are climatic factors, hydrological characteristics, topography and lithological factors (Oborie and Nwankwoala, 2014). The decline and degradation of its quality are not easily perceived. Generally they come in addition to easily accessible surface waters. Groundwater therefore requires more monitoring attention, as it is being threatened by increased anthropogenic activities and unsustainable practices (Nwankwoala, 2011). Urbanization rate, coupled with industrial activities, and indiscriminate disposal of waste (municipal and industrial) have impacted groundwater quality in Nigeria (Ocheri et al., 2014).
Moreover, the study area of Ogbia Local Government Area of Bayelsa State, Nigeria lies within a major oil-producing zone, petroleum contamination is a water quality concern. This risk is exacerbated by illicit tapping (“bunkering”) of oil pipelines, which can release significant amounts of crude oil into the environment (Onuoha, 2007). This study therefore assesses the physico-chemical properties and heavy metal concentrations of groundwater in Elebele community.
Study Area Description
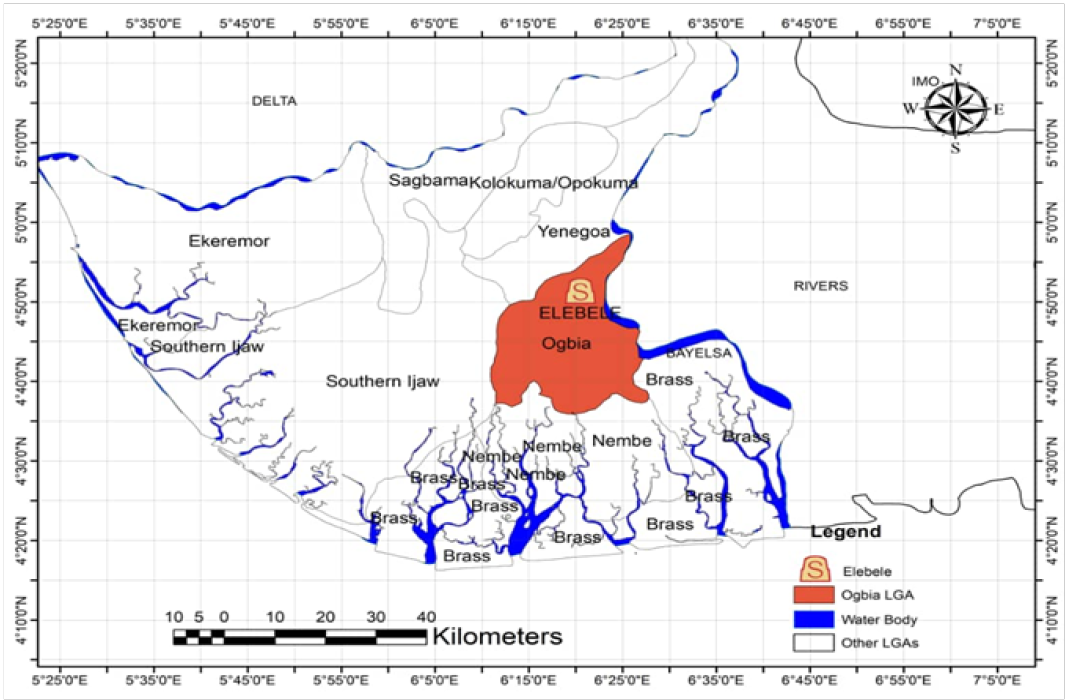
The area of study, Elebele is located in the North-East part of Bayelsa State in Ogbia Local Government Area. Geographically, the area lies between latitudes 40 51ˈ 21ˈˈN and longitudes 60 20ˈ 32ˈˈE (Figure 1). The annual rainfall distribution begins with the early rains in March, which ceases in November. In general, there should be only two seasons, but in climatology four seasons are actually discernible for the entire region.These seasons too are differentiated by rainfall and they are the early rainy season (March-July), little dry season (also called August break), late rainy season (September-November) and dry season (December-February). The most important role of rainfall to air pollution studies is that it acts as a scavenger by washing pollutants off the atmosphere. The amount and distribution of rainfall in the study area is such that it plays a salient role in moving pollutants from the atmosphere to other spheres of the environment. The mean annual rainfall for the study area is above 3000 mm. The highest rainfall values were obtained in July (424.6 mm), August (444.6 mm) and September (552.3 mm). Lowest rainfall values were obtained in January (42.7 mm) and December (51.1 mm). Maximum and minimum on site temperature for was 33.9oC measured at 15:00GMT and the minimum recorded was 24.2oC between 04:00 – 05:00GMT (Field work). Analysis from the macro data shows that the months of July-August recorded lower temperatures (28.7oC) due to rainy periods while the months December to March recorded higher temperatures (31-33.4oC) due to intense solar radiation prevalent in the dry season. (Table 1).
Table 1: Mean monthly temperature (oC) pattern of a close station (Yenagoa) to survey areas.
|
Month |
temperature (oC) |
|
Jan |
32.4 |
|
Feb |
33.4 |
|
Mar |
32.7 |
|
Apr |
32.1 |
|
May |
31.3 |
|
Jun |
30 |
|
Jul |
28.7 |
|
Aug |
28.7 |
|
Sep |
29.3 |
|
Oct |
30.2 |
|
Nov |
31.2 |
|
Dec |
31.8 |
(Source: NIMET, 2015)
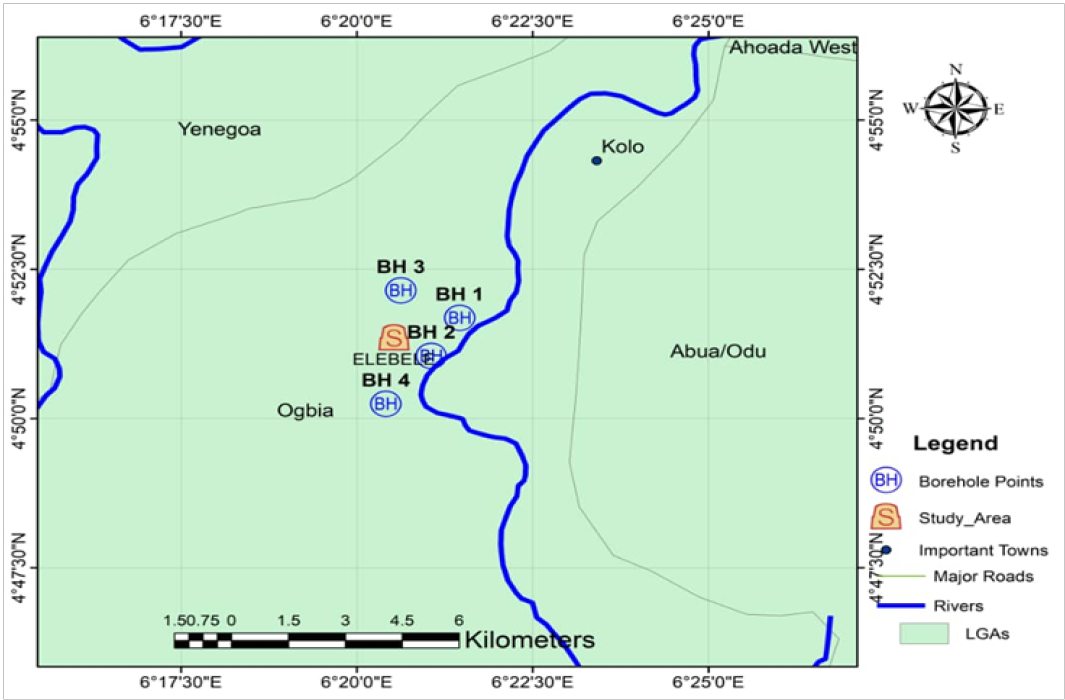
The study area (Figures 1 & 2) lies in the coastal Niger Delta sedimentary basin. The Niger Delta is one of the World’s largest Tertiary delta systems and an extremely prolific hydrocarbon province. It is situated on the West African continental margin at the apex of the Gulf of Guinea, which formed the site of a triple junction during continental break-up in the cretaceous. Throughout its history the delta has been fed by the Niger, Benue and Cross rivers, which between them drain more than 106 km2 of continental lowland savannah.
Figure 1: Map Showing Study Area
Figure 2: Map showing study area and sampling points
The Niger Delta comprises of three diachronous units, specifically Akata (most established), Agbada and Benin (most youthful) developments. The Benin Formation (Oligocene to Recent) is about 2100m thick at the basinfocus and comprises of medium to coarse grained sandstones, thin shales and rock (Weber and Daukoru, 1975). The Niger Delta has spread over various natural zones including sandy seaside obstructions, salty or saline mangrove, freshwater and occasional marsh timberlands. The Niger Delta has two most critical aquifers, Deltaic and Benin Formations. With a regularly dendritic waste system, this very penetrable sands of the Benin Formation enables simple penetration of water to revive the shallow aquifers. Nwankwoala et al., 2014 depicted the aquifers here as an arrangement of various aquifer frameworks stacked on one another with the unconfined upper aquifers happening at the best (Ngerebara et al., 2008). The recharge of aquifers is immediate from invasion of precipitation, the yearly aggregate of which shifts between 5000 mm at the drift to about 2540 mm landwards. Groundwater in the zone happens in shallow aquifers of overwhelmingly mainland deposits experienced at penetrations of somewhere in the range of 45m and 60m .The lithology contains a blend of sand in a fining up arrangement, rock and mud. Well yield is phenomenal, with generation rates of 20,000 liters/hour normal and borehole achievement rate is typically high (Amadi et al., 2012).
Methods
Groundwater level of the study area
Groundwater table conditions in the area were encountered in the four boreholes within the depths explored. Table 2 shows the depths of water table in the area.
Table 2: Groundwater Depths in the Study Area
|
S/No |
BH/No |
Groundwater Depths (m) |
|
1 |
BH-1 |
2.5 |
|
2 |
BH-2 |
0.7 |
|
3 |
BH-3 |
1.0 |
|
4 |
BH-4 |
2.0 |
Water levels recorded in the site BH-1(2.5 m), BH-2 (0.7 m), BH-3 (1.0 m) and BH-4 (2.0 m), respectively. Generally, static water level in most parts of the area range from 0 – 1 m during the wet season and 1 – 3 m during the dry season. Rainfall is the major source of recharge to aquifers in the area.
The water table in the area is affected by climate, rainfall and drainage condition. The study area is characterized by unconfined aquifers which contain a phreatic surface as an upper boundary that fluctuates in response to recharge and discharge (such as from a pumping well). Unconfined aquifers are generally close to the land surface and, for the most part, constitute shallow groundwater, with continuous layers of materials of high intrinsic permeability extending from the land surface to the base of the aquifer. In the unconfined aquifer, water table increases during the rainy seasons and falls during the dry season. The aquifers in this area obtain steady recharge through direct precipitation and major rivers (e.g. River Nun).Very limited water table fluctuation is expected in the areas where there is heavy rainfall nearly all the year round.
Laboratory Analysis of Water Samples
Sampling was carried out with two litres sterilized polyethylene bottles and filled to the brim. Bottles were labeled before sampling and gloves were worn when handling the bottles. Analysis of all primary water samples were carried out at an approved laboratory in Port Harcourt (Analytical Concept Limited) and in compliance with the World Health Organization (WHO 2008; 2011) standards. The water samples were analyzed for selected physical, chemical and heavy metals (Table 3). The results were compared to WHO standards for drinking water quality. Certain regularities established for the dissociation of major inorganic constituents in groundwater were also applied to cross-checking the reliability of available data sets. The samples were checked for reliability and accuracy using a combination of methods.
Table 3: Equipment and Analytical Methods used for Physico-chemical Analysis
|
Parameter |
Type of test |
Equipment/Analytical Method |
Standard |
|
pH |
In-situ |
Digital pH meter |
APHA 4500H*B |
|
Temperature |
In-situ |
Mercury-in-glass thermometer |
|
|
Conductivity |
In-situ |
Digital conductivity meter |
APHA 2510B |
|
Turbidity |
Laboratory |
HACH2100AN tubidimeter |
APHA2130B |
|
Calcium, Magnesium, Potassium, Alkalinity |
Laboratory |
Direct atomic absorption |
ASTMD511-93 |
|
Sodium, Hardness |
Laboratory |
Titration method |
ASTM512B |
|
Total Dissolved Solids |
Laboratory |
Filtration and evaporation |
APHA 2510A |
|
Sulphate and Phosphate |
Laboratory |
Turbidimetric method |
ASTMS-516 |
|
Chloride |
Laboratory |
Silver nitrate titration |
ASTM512B |
|
Nitrate |
Laboratory |
Brucine method |
APHA 4500*E |
|
Bicarbonate |
Laboratory |
Colorimetric method |
|
|
Heavy metals |
Laboratory |
Atomic absorption spectrophotometer |
APHA 3111B |
Results and Discussion
The results of the physical and chemical analysis of the groundwater parameters of the area show a wide variation in different individual parameters.
Table 4: Physical Parameters of Groundwater in Elebele Community
|
Sample ID |
EC (µS/cm) |
TDS (mg/l) |
TSS (mg/l) |
Turbidity (NTU) |
Temperature (ºC) |
|
A |
147.7 |
116.0 |
0.008 |
6.0 |
27.07 |
|
B |
206.8 |
105.8 |
0.04 |
73.0 |
28.96 |
|
C |
137.7 |
106.0 |
0.01 |
5.0 |
26.88 |
|
D |
166.8 |
115.8 |
0.03 |
71.0 |
26.18 |
|
Mean ± SD |
164.75 ± 15.26 |
110.9 ± 2.89 |
0.022 ± 0.00 |
38.75 ± 19.20 |
27.27 ± 0.59 |
|
WHO limit |
500 |
500 |
25 |
5 |
25.00 |
Discussion of the Physical Properties of Groundwater
Electrical Conductivity (EC): The electrical conductance, or conductivity, is the ability of a substance to conduct an electric current. The electrical conductivity (EC) in the study area ranges from 147.7 µS/cm – 206.8 µS/cm. It gives an idea of the amount of total dissolved salts (TDS) present in the water.Conductivity increases as the TDS increases and in general, the corrosivity of the water increases as TDS and electrical conductivity increase. Electrical conductance depends on temperature and types and concentration of different dissociated ions in the water. Temperature is usually taken as 25oC hence electrical conductivity depends only on type and concentration of dissociated species present in the water. Hence, the electrical conductivity of the area is within the permissible limit of (WHO, 2006).
Total Dissolved Solids (TDS): The values obtained were ranged between 105.8-116.0 mg/l which fell within the recommended limit of 500 mg/l (FME) and 1000 mg/l (WHO, 2011). High TDS values indicate hard water and the presence of toxic minerals. Some of the dissolved solids emanate from organic sources like leaves, planktons, sewage, run-offs, rocks and air that may contain calcium bicarbonate, nitrogen, iron, phosphorus, sulphur and other minerals.
Total Suspended Solids (TSS): The concentration of TSS ranges from < 0.04 to 0.04 mg/l in borehole waters in the study area. WHO (2006) stipulates 10 mg/l as the desirable level of TSS and a maximum permissible limit of 25 mg/l in drinking water. In the study area, the highest TSS value (0.04 mg/l) was recorded in Federal Housing Authority (BH 2). A comparison of measured TSS value with WHO (2006) standards shows that the water samples are within the maximum permissible limit implying that the water is suitable for drinking/domestic uses, except for industrial purposes in which there may be need for treatment before use.The low value of TSS in the area in site is due to very high static water level (SWL). Suspended solids in water can be removed by sedimentation or water filtration.
Turbidity: The turbidity values obtained ranged from 5 to 73 NTU in Elebele community. These values are relatively very high considering the limit of 5mg/l recommended by the Federal Ministry of Environment (FME). According to Boyd (1999) may be due to receipt of sediments and particulates from upland. Turbidity increases near areas of turbulence.
Temperature: Temperature is an essential element to control all the physicochemical parameters of a given system. It controls the solubility, density and viscosity of water, as well as the speed of chemical reactions. It has a direct effect on the conductivity and pH determination of the water.The temperature values in the ground water of the study area ranged from 26.18 to 29.96 but 25.00 0C in the control station of river Nun. There was statistically significant difference in temperature values when compared to the control station. The temperature value obtained was in a range suitable for the sustenance of aquatic life in both the Nun River and Elebele community.
Table 5: Chemical Parameters of groundwater in Elebele community
|
Station Parameter |
A |
B |
C |
D |
WHO Limits |
|
pH (units) |
6.87 |
6.81 |
6.44 |
6.44 |
8.5 |
|
THC (mg/l) |
0.005 |
0.004 |
0.005 |
0.007 |
10 |
|
Hardness (mg/l) |
41.19 |
74.16 |
62.26 |
52.16 |
500 |
|
Salinity (mg/l) |
50 |
100 |
100 |
800 |
1000-5000 |
Discussion of Chemical Properties of Groundwater
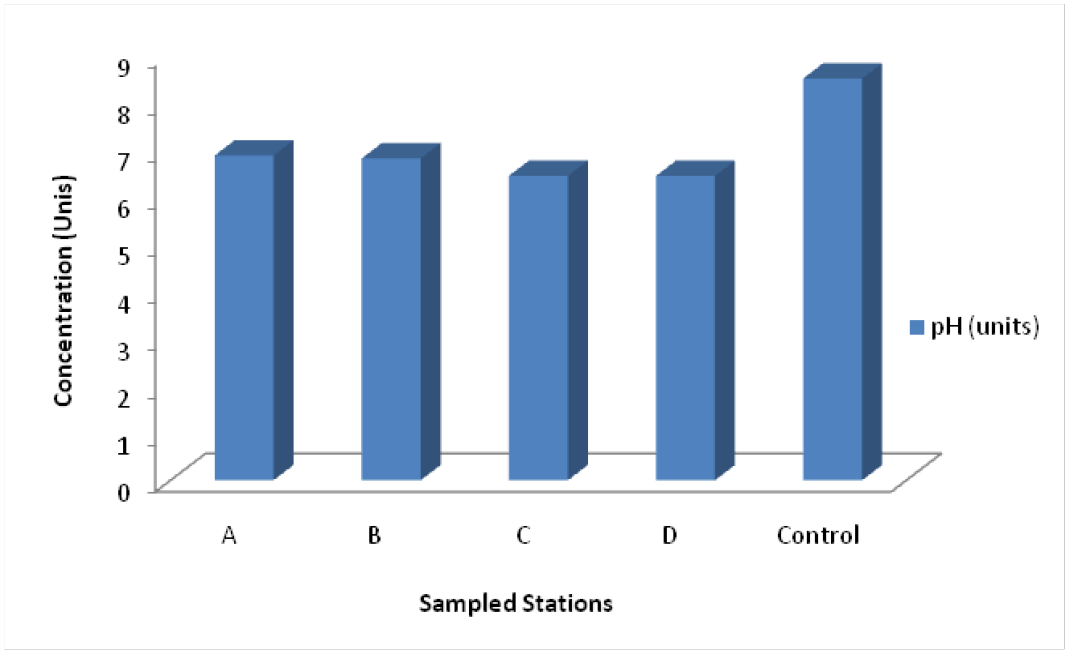
pH: pH represents the negative base -10 log of the hydrogen-ion activity in water. It is measured in moles per litre. Even when no other solutes are present, a few of the H2O molecules in liquid water will be broken up into H+ and OH- ions. This process of dissociation is a chemical equilibrium that may be written as: H2O (l) = H+ + OH-. For neutral waters, H+ equals OH- = 7. Water is considered alkaline when OH- ions > H+ ions and pH > 7. When the H+ > OH- and pH < 7, the water is described as acidic. The physicochemical equilibrium of a source or a well is essentially determined by the pH. The latter is very sensitive to environmental and geological factors such as, temperature, salinity, lithological nature of the area etc. Acidic pH can influence dissolution of salts from the aquifer rocks and increase the metal and TDS load in the groundwater (Akhtar et al., 2014). The values range from 6.41 – 6.56, indicating slightly alkaline. Interestingly, all the values are within WHO standards. Hem (1991) noted that water with pH values between 4.0 and 6.0 are usually associated with small amounts of mineral acids from sulphide sources and/or organic acids. Those with pH less than 4 contain free acid. Waters with pH values between above 7 are high in bicarbonate ions (Figure 3).
Figure 3: pH of groundwater in Elebele community
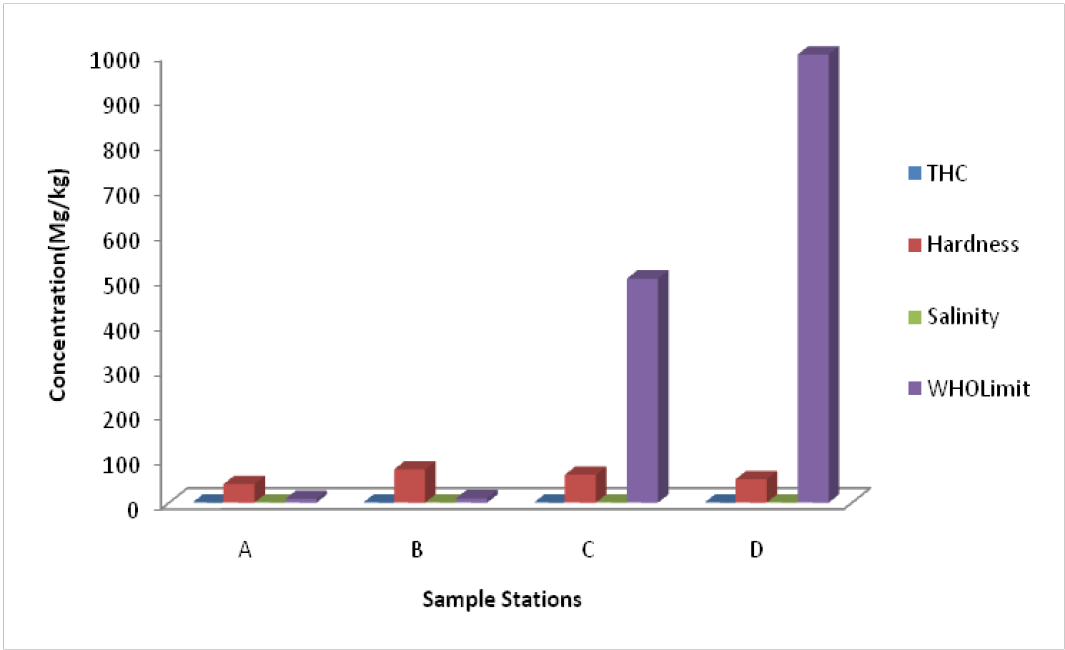
Total Hydrocarbon Content (THC): The THC recorded in the study project area had a uniform value of less than the WHO standard of 10 mg/kg for the groundwater.
Total Hardness: The hardness of water is the sum of the ions which can precipitate as hard particles from water mainly Ca2+ and Mg2+. This is regarded as Ca2+ + Mg2+ or Total hardness. It is usually expressed in meq/l. (Appelo and Postma, 2005). It is assessed by the ability of the water to precipitate soap. This parameter is very important in manufacturing processes. Hardness values in the study area range from 48.65 mg/l - 49.31 mg/l whereas the World Health Organization, (WHO, 2011) sets 100 mg/l and 500 mg/l as highest desirable and maximum permissible values respectively. The implication is that groundwater in most parts of the study area are within WHO standard for hardness. When the hardness is very low, ≤ 10 mg/l, the water becomes corrosive and capable of dissolving heavy metals such as iron causing corrosion and incrustation. Hardness is therefore not a major quality issue in groundwater in the area. (Figure 4).
Figure 4: Chemical Parameters of groundwater in Elebele community
Salinity: Salinity is the mass of salts or ionic compounds dissolved in a liter of water; it is expressed in g/L of water. An ionic compound or crystalline ionic solid consists of positively charged cations and negatively charged anions regularly arranged in space. An ionic crystal is electrically neutral. The salts can be of geogenic origin from rock weathering or anthropogenic origin like urban runoff, sewage, industrial discharge and type of material used in piping for water supply (Raju et al., 2015). Salinity which is a dynamic indicator of the nature of the exchange system is expressed as the total concentration of electrically charged ions (cations) in the surface water in parts per thousand (%0). The salinity helps to tell how much fresh water has mixed with sea water. A value for salinity in the project area maintained a range of 0.05 and 0.08 %0 as against 1000-5000 %0 of the WHO standard.
Heavy Metal Concentration Levels
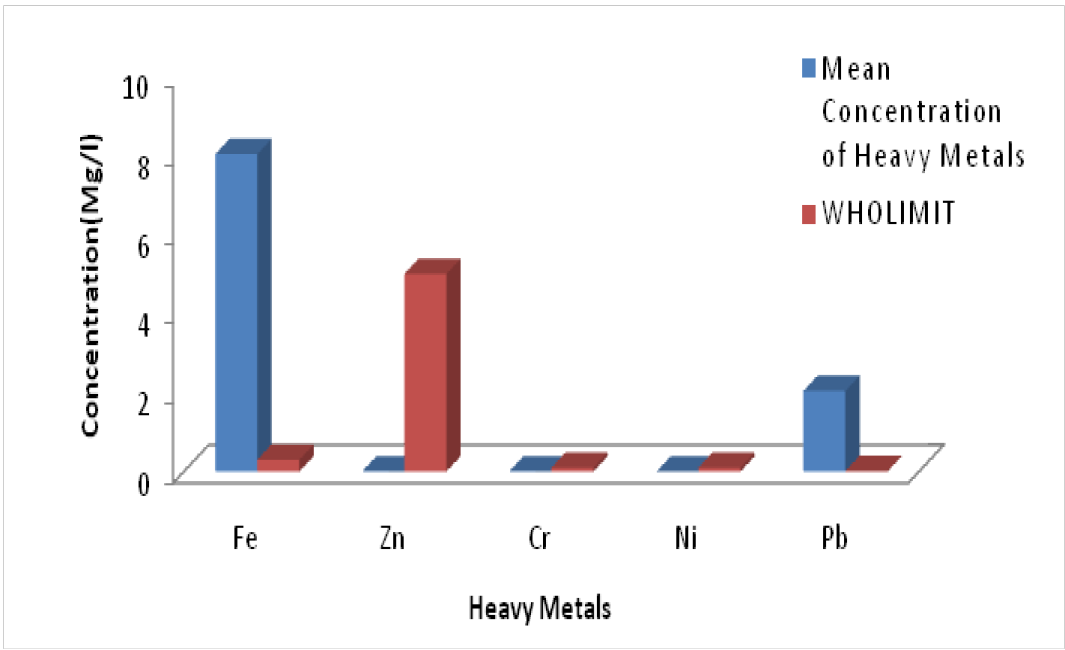
The heavy metals include: Fe, Pb, Zn, Ni and Cr. These are shown in Figure 5 and Table 6.
Figure 5: Groundwater Heavy metals concentration in the surface water of Elebele community
Table 6: Groundwater Heavy metals in Elelebele Community (Mg/l)
|
Sample Site |
Fe |
Zn |
Cr |
Ni |
Pb |
|
A |
0.345 |
0.01 |
0.01 |
0.01 |
2.024 |
|
B |
16.23 |
0.007 |
0.01 |
0.006 |
2.049 |
|
C |
3.412 |
0.01 |
0.01 |
0.008 |
2.084 |
|
D |
12.14 |
0.01 |
0.01 |
0.01 |
2.033 |
|
Mean ± SD |
8.03 ± 3.70 |
0.01 ± 0.00 |
0.01 ± 0.00 |
0.00 ± 0.00 |
2.04 ± 0.01 |
|
WHO limit |
0.3 |
5.0 |
0.1 |
0.1 |
0.015 |
Conclusion
Based on the findings, the study concludes that there was considerable amount of heavy metals in groundwater, though the levels were below WHO maximum permissible levels for Ni, zinc and Cr. Also, Fe and Pb exceeded the WHO maximum permissible limit. This study has proven the effective use of physico-chemical and heavy metal levels in defining the overall quality of water in Elebele Community and its environs, along with hotspots that needs immediate attention. The results of the this study could also serve as a decision making tool that will aid in establishment of treatment facilities to improve the quality of water in the affected areas. It is therefore, recommended that the levels of lead and Iron in the water should be continuously monitored by the relevant agencies to check on their levels. Lead levels in groundwater is already beyond the WHO recommended maximum limit. It is therefore suggested and recommended that an appropriate mechanism be established for continuous monitoring of the groundwater quality for its hydrochemistry so that a strategy and action plan is developed for the conservation and restoration of this important resource in the area.
Conflicts of Interest: None.
References
- Aiyesanmi, A.F., Ipinmoroti, K.O., Oguntimehin, II. Impact of automobile workshop on groundwater quality in Akure Metropolis. (2004) J Chem Soc Nig (Supplement to 2004 Proceeding) pp: 420–426.
PubMed│CrossRef│Others
- Akhtar, M.M., Tang, Z., Mohamadi, B. Contamination potential assessment of potable groundwater in Lahore. (2014) Pol J Environ Stud 23(6): 1095-1916.
PubMed│CrossRef│Others
- Appelo, C.A.J., Postma, D. Geochemistry, Groundwater and Pollution, 2nd Ed. (2005) (A.A. Balkema Publishers, Rotterdam).
PubMed│CrossRef│Others
- Amadi, A.N., Olasehinde, P.I., Yisa, J. Geostatistical assessment of groundwater quality from coastal aquifers of eastern Niger Delta, Nigeria. (2012) J Geosci 2(3): 51–59.
- Babiker, I.S., Mohamed, A.A., Hiyama, T., et al. A GIS-based DRASTIC model for assessing aquifer vulnerability in Kakami-gahara Heights, Gifu Prefecture, Central Japan. (2005) Sci Total Environ 345(1-3):127–140.
- Boyd, C.E. Water Quality: An Introduction. (1999) Kluwer Academic Publishers Group, The Netherlands.
PubMed│CrossRef│Others
- Delgado, C., Pacheco, J., Cabrera, A., et al. Quality of groundwater for irrigation in tropical karst environment: the case of Yucatan, Mexico. (2010) Agric Water Manag 97(10): 1423–1433.
- Edmunds, W.M., Ma, J., Aeschbach-Hertig, W., et al. Groundwater recharge history and hydrogeochemicalevolution in the Minqin Basin, North West China. (2006) Appl Geochem 21(12): 2148–2170.
- Ekpete, O.A. Determination of Phsico-Chemical Parameters in borehole water in Odihologboji community in Rivers State. (2002) Afr J Interdiscip Stud 3(1): 23-27.
PubMed│CrossRef│Others
- Hem, J.D. (1991) Study and Interpretation of the Chemical Characteristics of Natural Water. Geological Survey Water-Supply Paper 2254, U.S. Government Printing Office, Washington DC, 363 p.
PubMed│CrossRef│Others
- Guendouz, A., Moulla, A., Edmunds, W., et al. Hydrogeochemical and isotopic evolution of water in the Complex Terminal aquifer in the Algerian Sahara. (2003) Hydrogeol J 11(4): 483–495.
PubMed│CrossRef│Others
- NIMET. The Nigerian Meteorological Agency (NiMet). (2015) First Quarter Weather Bulletin for 2015.
PubMed│CrossRef│Others
- Ngerebara, O.D., Nwankwoala, H.O. Groundwater potentials in the offshore Niger Delta environment, Nigeria. (2008) Electronic J Environ Hydrol 16: 28.
PubMed│CrossRef│Others
- Nwankwoala, H.O. An integrated approach to sustainable groundwater development and management in Nigeria. (2011) J Geol Min Res 3(5):123–130.
PubMed│CrossRef│Others
- Nwankwoala, H.O., Amadi, A.N., Oborie, E. Hydrochemical factors and correlation analysis in groundwater quality in Yenagoa, Bayelsa State, Nigeria. (2013) J Appl Ecol Environ Sci 2(4): 100–105.
PubMed│CrossRef│Others
- Nwankwoala, H.O., Marshal, H.I., Oborie, E. Characterization and quantitative indicators of ground water quality in Okrika, Rivers State, Nigeria. (2014) Intl J Sci Invent Today 2(4): 319–334.
PubMed│CrossRef│Others
Oborie, E., Nwankwoala, H.O. Analysis of major ions constituents in Groundwater in Amassoma and Environs, Bayelsa state, Nigeria. (2014) J Appl Chem 2(5): 1-13.
PubMed│CrossRef│Others
- Ocheri, M.I., Odoma, L.A., Umar, N.D. Groundwater quality in Nigerian urban areas: a review. (2014) Glob J Sci Front Res 14(3): 1–13.
PubMed│CrossRef│Others
- Odukoya, O.O., Arowolo, T.A., Bamgbose, O. Effect of Solid Waste Landfill on underground and surface water quality at Ring Road, Ibadan. (2002) Global J Environ Sci 1(1): 43-52.
- Onuoha, F.C. Oil pipeline sabotage in Nigeria: dimensions, actors and implications for national security. (2007) African Secur Rev 17: 99–115.
- Oyinloye, A.O., Jegede, G.O. Geophysical Survey, Geochemical and Microbiology Investigation of ground well water in Ado–Ekiti, North, South Western Nigeria. (2004) Global J Geol Sci 2(2): 235-242.
PubMed│CrossRef│Others
- Prasanna, M.V., Chidambaram, S., Srinivasamoorthy, K. Statistical analysis of the hydrogeochemical evolution of groundwater inhard and sedimentary aquifers system of Gadilam river basin, South India. (2010) J King Saud Univ Sci 22(3):133–145.
- Raji, M.I.O., Ibrahim, Y.K.E., Ehinmidu, J.O. Physiochemical characteristics and heavy metal levels in drinking water resources in Sokoto Metropolis in North-western Nigeria. (2010) J Appl Sci Environ Manage 14(3): 81-85.
PubMed│CrossRef│Others
- Raju, N.J, Patel, P., Gurung, D., et al. Geochemical assessment of groundwater quality in the Dun valley of central Nepal using chemometric method and geochemical modeling. (2015) Groundwater for Sustain Develop 1(1-2): 135-145.
- U.S.E.PA. Environmental Protection Agency. National Secondary Drinking Water Standards (2002).
PubMed│CrossRef│Others
- Weber, K.J., Daukoru, E.M. Petroleum geology of the Niger delta. (1975) 9th World Petroleum Congress Proceedings 2: 209–221.
PubMed│CrossRef│Others
- World Health Organisation (WHO). International Standards for Drinking Water Quality. (2006)3rd edition, Geneva, 346-385.
PubMed│CrossRef│Others
- World Health Organization (WHO). Guideline for drinking water quality. Health Criteria and other supporting information. (2008) 3rd, Geneva.
PubMed│CrossRef│Others
- World Health Organization (WHO). Guidelines for drinking water quality criteria. (2011) 4th ed. Geneva, 307-441.
PubMed│CrossRef│Others
- Yahaya, M.I., Ezeh, G., Musa, F.Y., et al. Analysis of heavy metals concentration in roadside soils of Yauri, Nigeria. (2010) Afr J Pure Appl Chem 4: 22-30.
PubMed│CrossRef│Others


