Rapid Perioperative Changes in the Quantitative Properties of Plasma Lipases and Lipoproteins in Morbidly Obese Surgical Patients
Juan Antonio Baena-Fustegueras1*†, Roser Ferrer2, Albert Lecube1, David Ricart-Jané3, Joana Rossell3, Julia Peinado Onsurbe3*â€
Affiliation
- 1University Hospital Arnau de Vilanova (University of Lleida), Surgery Unit, Endocrinology and Nutrition Department. Research unit in Diabetes and Metabolism, Research Institute of Valld’Hebron (UAB) and CIBERDEM (ISCIII).
- 2Department of Biochemistry, University Hospital Valld’Hebron, UAB, Spain
- 3Department of Biochemistry and Molecular Biomedicine, Faculty of Biology, University of Barcelona, Spain
- †Juan Antonio Baena-Fustegueras and Julia Peinado Onsurbe share senior authorship
Corresponding Author
Dr. Julia Peinado-Onsurbe, Department of Biochemistry and Molecular Biomedicine, Faculty of Biology, University of Barcelona, Av. Diagonal 643, 08028 Barcelona, Spain, Tel: +34-934021524/48; Fax: +34-934021559; E-mail: jpeinado@ub.edu
Citation
Baena-Fustegueras, J.A., et al. Rapid Perioperative Changes in the Quantitative Properties of Plasma Lipases and Lipoproteins in Morbidly Obese Surgical Patients. (2017) J diab Obes 4(2): 1- 11.
Copy rights
© 2017 Peinado-Onsurbe, J. This is an Open access article distributed under the terms of Creative Commons Attribution 4.0 International License.
Keywords
Morbid obesity; Surgical stress; Lipids; Lipoproteins; Lipolytic enzymes; Gastric bypass
Abstract
Background: The impact of bariatric surgery on abnormalities in blood lipids and lipoprotein metabolism during the perioperative period has been poorly studied.
Objective: We studied the impact of bariatric surgery on the composition and quantitative properties of lipoproteins and the activity of lipases in the plasma of perioperative morbidly obese patients.
Methods: We examined the plasma lipoproteins and lipolytic activities of 34 morbidly obesepatients one month before surgery (OB), pre-anaesthesia (-S), post-anaesthesia (+S), and one day and one month after open Roux-en-Y gastric bypass (RYGB) surgery.
Results: Surgical injury induced acute stress, as evidenced by transitory hyperglycaemia and elevated plasma levels of stress hormones. Lipid profiles revealed a significant reduction during surgery and the day after in the plasma levels of total cholesterol (p < 0.0001), which was mainly due to a decrease in low-density lipoprotein cholesterol (cLDL) and was confirmed with a significant reduction in the plasma levels of LDL (approximately 26% reduction). Significant (p < 0.0001) changes were detected in the plasma levels of high-density lipoprotein cholesterol (cHDL) as well as a significant decrease (approximately 19% reduction) in the plasma levels of HDL. A significant (p < 0.0001) rise was noted in the plasma levels of both Lipoprotein Lipase (LPL) (approximately 2.6-fold increase) and hepatic lipase (HL) (approximately 2.2-fold increase) on the day after surgery, occurring simultaneously with the maximum increase in C-reactive protein (CRP) and a day after the peak values for non-esterified fatty acid (NEFA), adrenocorticotropin hormone (ACTH), cortisol and glucose.
Conclusion: The present study reveals unreported quantitative perioperative changes in plasma lipases and lipoproteins and related metabolic determinants that may contribute to the adaptive metabolic response to RYGB-induced stress.
Summary
There was a significant rise in the plasma levels of plasma lipases on the day after surgery in morbidly obese patients, co-occurring with the maximum increase in C-reactive protein.
Lipid profiles revealed a significant reduction during surgery and the day after in the plasma levels of cholesterol. Stress pre-/post-surgery caused important changes in NEFA, ketone bodies and other related parameters that could be used as markers of surgery risk.
Introduction
Roux-en-Y gastric bypass (RYGB) is one of the most frequently employed surgical techniques used to sustain body weight reductions in morbidly obese patients. Most studies show impressive postoperative improvements in well-established cardio metabolic risk factors, including the plasma levels of lipids and lipoproteins (Williams et al., 2007; Schernthaner et al., 2008; Ay et al., 2010), in morbidly obese patients in the months following RYGB surgery. However, these factors have not been evaluated during and immediately following surgery.
Hyperglycaemia induced by surgical stress is a well-documented clinical phenomenon that is characterized by insulin resistance (Seematter et al., 2004) and has been at least in part attributed to the concomitant release of stress hormones during and after surgery. Supporting this concept, elevations in the plasma levels of stress hormones (i.e., adrenocorticotropin [ACTH] and cortisol) and glucose have been reported immediately after surgery (Nguyen et al., 2002a), with baseline levels recovering within 24h thereafter.
Aside from the adrenocortical response, a parallel adrenomedullary response occurs during different early phases of the bariatric perioperative period (Nguyen et al., 2002b). Inflammation is also induced by RYGB, as several systemic cytokines have been revealed as acute physiological stress markers in the perioperative phases of abdominal surgery (Maruna et al., 2008). In particular, plasma levels of CRP and IL-6/IL-8 are elevated during the early perioperative stages of RYGB (Nguyen et al., 2002 a,b; Schernthaner et al., 2008).
Circulating levels of lipoproteins are influenced by inflammation and the acute phase response (Carpentier & Scruel, 2002; Jahangiri, 2010; Chung et al., 2011). However, the impact of surgery-induced stress on the plasma levels of both LDL and HDL during the perioperative period is controversial (Leszczynski et al., 1980; Carpentier & Scruel, 2002; Jahangiri, 2010).
Despite the long-term benefits of RYGB on lipid and lipoprotein metabolism in morbidly obese patients (Pardina et al., 2009a; Julve et al., 2014), the direct analysis of its impact on lipids and lipoproteins during the early perioperative stages remains elusive. Given that surgery-induced biochemical abnormalities in the quantitative properties of lipoproteins worsen there at herogenic and inflammatory properties (Carpentier & Scruel, 2002), lipoprotein levels in gastric bypass patients may be clinically relevant.
This study examines the metabolic response to acute stress occurring during the perioperative phases of RYGB on the quantitative properties of plasma lipases and lipoproteins. Furthermore, this work will elucidate any identified association of lipases and lipoproteins with known and potentially novel acute perioperative phase markers.
Materials and Methods
Patient Selection
A group of 34 subjects was recruited from morbidly obese patients (24 women and 10 men) between 20 and 60 years of age undergoing open RYGB surgery at the University Hospital, as described elsewhere (Pardina et al., 2009a; Julve et al., 2014). The diagnostic criteria used for comorbidities are detailed in the National Cholesterol Education Program (NCEP, 2001). All subjects were free of inflammatory and infectious diseases, and none were receiving anti-obesity or anti-inflammatory drugs at the time of the study. Patients were excluded if they had neoplastic, renal, or active systemic diseases; hypothyroidism; or an endocrine disease other than diabetes. All patients reported that their weight had been stable during the previous three months. None of the diabetic patients were being treated with insulin. The patients presented the necessary indications for bariatric surgery: BMI > 40 kg/m2 or greater than 35 kg/m2 with one or more comorbidities. Blood samples were drawn one month before surgery (OB), immediately before surgery (-S), immediately after surgery (+S), one day after surgery (1d), and 1 month after surgery (1M). The anaesthetic procedure was standardized for open RYGB. For induction, 2 mg•kg-1 ideal weight of propophol and fentanyl was administered. During surgery, anaesthesia was maintained with desflurane, 0.45 mg•kg-1•h-1 of rocuronium bromide and 4 μg•kg-1•h-1 of fentanyl. Epinephrine was avoided.
For the control non-obese group of surgery (CS), we used blood samples obtained from 22 surgical non-obese patients (30 – 80 years old) admitted to the same University Hospital. Patients were submitted to open surgery for colectomy (for colon carcinoma) or gas trectomy (for gastric carcinoma). The anaesthetic procedure was as described above. Exclusion criteria were hepatic or renal failure, acute or chronic infection, diabetes mellitus or pregnancy. Blood samples were drawn 3 days before surgery (-3), immediately after surgery (0), and one day after surgery (1).
For the non-stressed control (C) group, we used blood samples obtained from 21 students (18-25 years old) through a volunteer donor blood bank.
The study protocol was reviewed and accepted by the hospital ethics committee, and all subjects (patients and students) gave their written informed consent to participate.
All blood samples were taken under fasting conditions at 8:00 and 10:00 am. Plasma was separated immediately by centrifugation (2000xg, 30 min, 4°C), and aliquots were frozen at -80°C for subsequent analysis.
Anthropometric and Body Composition Measurements
Body weight, height, and waist and hip circumferences were measured according to standard procedures (Pardina et al., 2009a). The body mass index (BMI) (kg/m2) was calculated for all subjects.
Analytical methods
Fasting plasma glucose, triglycerides, non-esterified fatty acids (NEFA), total cholesterol, and high- and low-density lipoprotein cholesterol (cHDL and cLDL, respectively) were enzymatically measured using the hospital’s routine chemistry laboratory. Human apoA-I and apoB were quantified using commercially available turbidimetric assays (RAL). Human apoA-IV was determined by western blot assays as described elsewhere (Pardina et al., 2009b). Ketone bodies (KB) were indirectly determined by quantification of β-hydroxybutyrate via an enzymatic method (Kientsch-Engel et al., 1982).
Lipoprotein analysis
Lipoprotein fractions were isolated by sequential micro-ultracentrifugation according to Rodríguez-Sureda et al. (2002). Lipoprotein sub fraction composition was analysed for lipids, including total cholesterol, free cholesterol, phospholipids, and triglycerides, and protein (total protein content) at the indicated times using commercial methods.
Determination of plasma levels of stress hormones and CRP
ACTH, insulin and cortisol were measured in the IMMULITE 2500 auto analyser (Siemens Healthcare, Spain). The method for cortisol quantification was based on a competitive chemiluminescent enzyme immunoassay in solid phase. The insulin and ACTH assays were based on non-competitive chemiluminescent immunometric assays with two binding sites in the solid phase.
The homeostatic model assessment of insulin resistance (HOMA-IR) was calculated as previously described by Matthews et al. (1985). Plasma CRP was determined using a turbidimetric assay (Gernon, RAL; Spain).
LPL activity and mass assay
LPL was assayed as previously described by Ballart et al. (2003). Endothelial lipase (EL) has no triglyceride hydrolase activity when 3 - 5% serum is present in the assay (McCoy et al., 2002). LPL mass was measured using an LPL ELISA kit (Sekisui Diagnostics).
HL activity assay
HL activity was determined using the method described by Ehnholm & Kuusi (1986), with minor modifications. Both LPL and EL are inactive in this lipase assay due to the high NaCl concentration (Hultin et al., 1994). LPL is also inactive due to the lack of a serum cofactor.
Statistical analysis
The results are presented as the mean ± SEM. Significant differences between the non-stressed control group (C) and the obese (OB) and the different time-points perioperative surgery (-S, +S, 1d, and 1M) on the plasma chemical parameters and on the composition and quantitative properties of lipoproteins were assessed using one-way ANOVA and Tukey’s multiple comparison post-tests. Significant differences between the non-stressed control group (C) and the obese (OB) at the different time-points perioperative surgery (-S, +S, 1d, and 1M) and non-obese control surgery (CS) at the different time-points perioperative surgery (-3, 0 and 1) on the plasma chemical parameters were assessed using two-way ANOVA (anova-2) and Bonferroni multiple comparison post-tests. Correlations between the independent variables were determined by the multiple Spearman’s correlation coefficient (rho). Statistical comparisons were considered significant when p < 0.05.
All statistical analyses were computed using GraphPad Prism version 5.00 for Windows (GraphPad Software, San Diego California USA, www.graphpad.com).
Results
Perioperative impact of RYGB on clinical and biochemical characteristics of obese patients before and after bariatric surgery
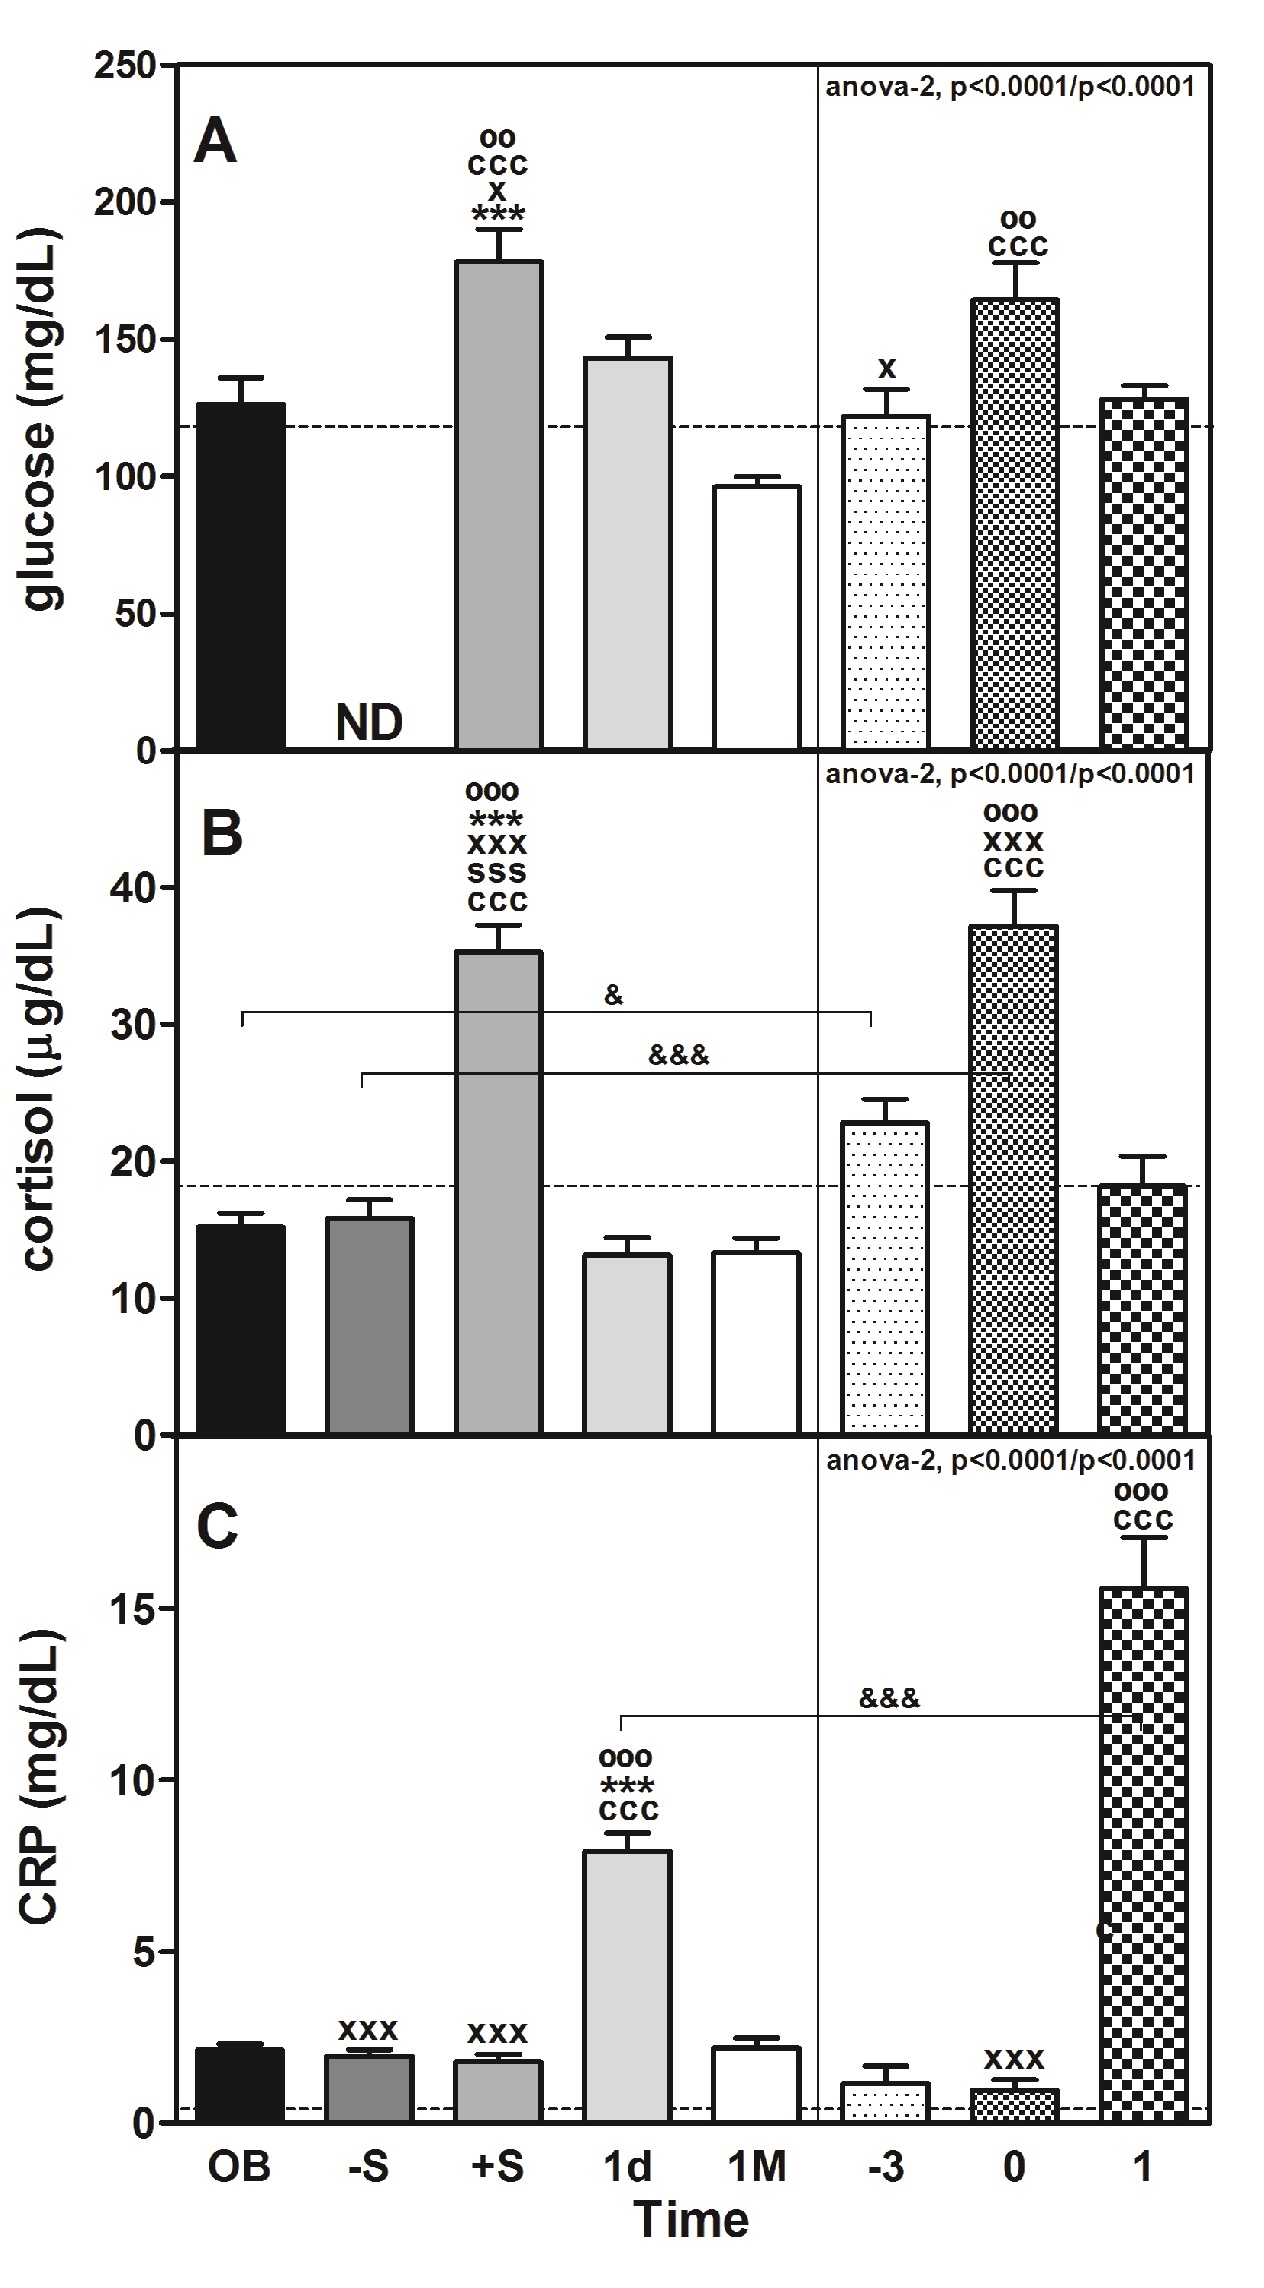
As shown in Table 1, RYGB surgery produced a favourable decline in the body weight and BMI of morbidly obese patients 1M after intervention. The plasma levels of glucose (Table 1 and Figure 1, panel A) increased significantly immediately after surgery (+S; approximately 1.4-fold vs. OB; P < 0.001, Table 1) in obese (OB) and non-obese stressed (CS) patients after surgery (0) vs. before surgery (-3) (approximately 1.3-fold; P < 0.01). Plasma glucose levels tend to recover to C values the day following surgery in OB and CS. Plasma insulin levels and insulin resistance (HOMA-IR) in OB significantly decreased (approximately 1.7-fold, P < 0.05 and 2.3-fold, P < 0.01, respectively) 1M after surgery.
Perioperative impact of RYGB on the plasma levels of stress hormones and CRP
Plasma levels of glucose are a marker of acute stress and are positively related to stressor intensity and could be used to evaluate it (Armario et al., 1990). As we commented before, the surgery was associated with an increase in that parameter in both OB and CS (Table 1 and Figure 1, panel A). The plasma levels of cortisol reached a peak (approximately 2.3-fold vs. OB; P < 0.001 and 1.6-fold vs. -3; P < 0.001) during the same post-surgicalphase (+S or 0, respectively) (Figure 1, panel B). That peak was coincident with the peak of glucose but also with the ACTH peak (10-fold; P < 0.001) immediately after surgery (+S) compared with the OB values and dropped until reaching baseline values 1d after surgery (data not shown). The levels of both hormones were directly correlated (rho = 0.703, P < 0.001; Table 3). Remarkably, the plasma levels of cortisol were different (P < 0.05) between OB and CS, but in both cases were directly correlated (Table 3) with the plasma levels of glucose (OB: rho = 0.376, P < 0.001; CS: rho = 0.301, P < 0.05). That correlation did not exist in the C group.
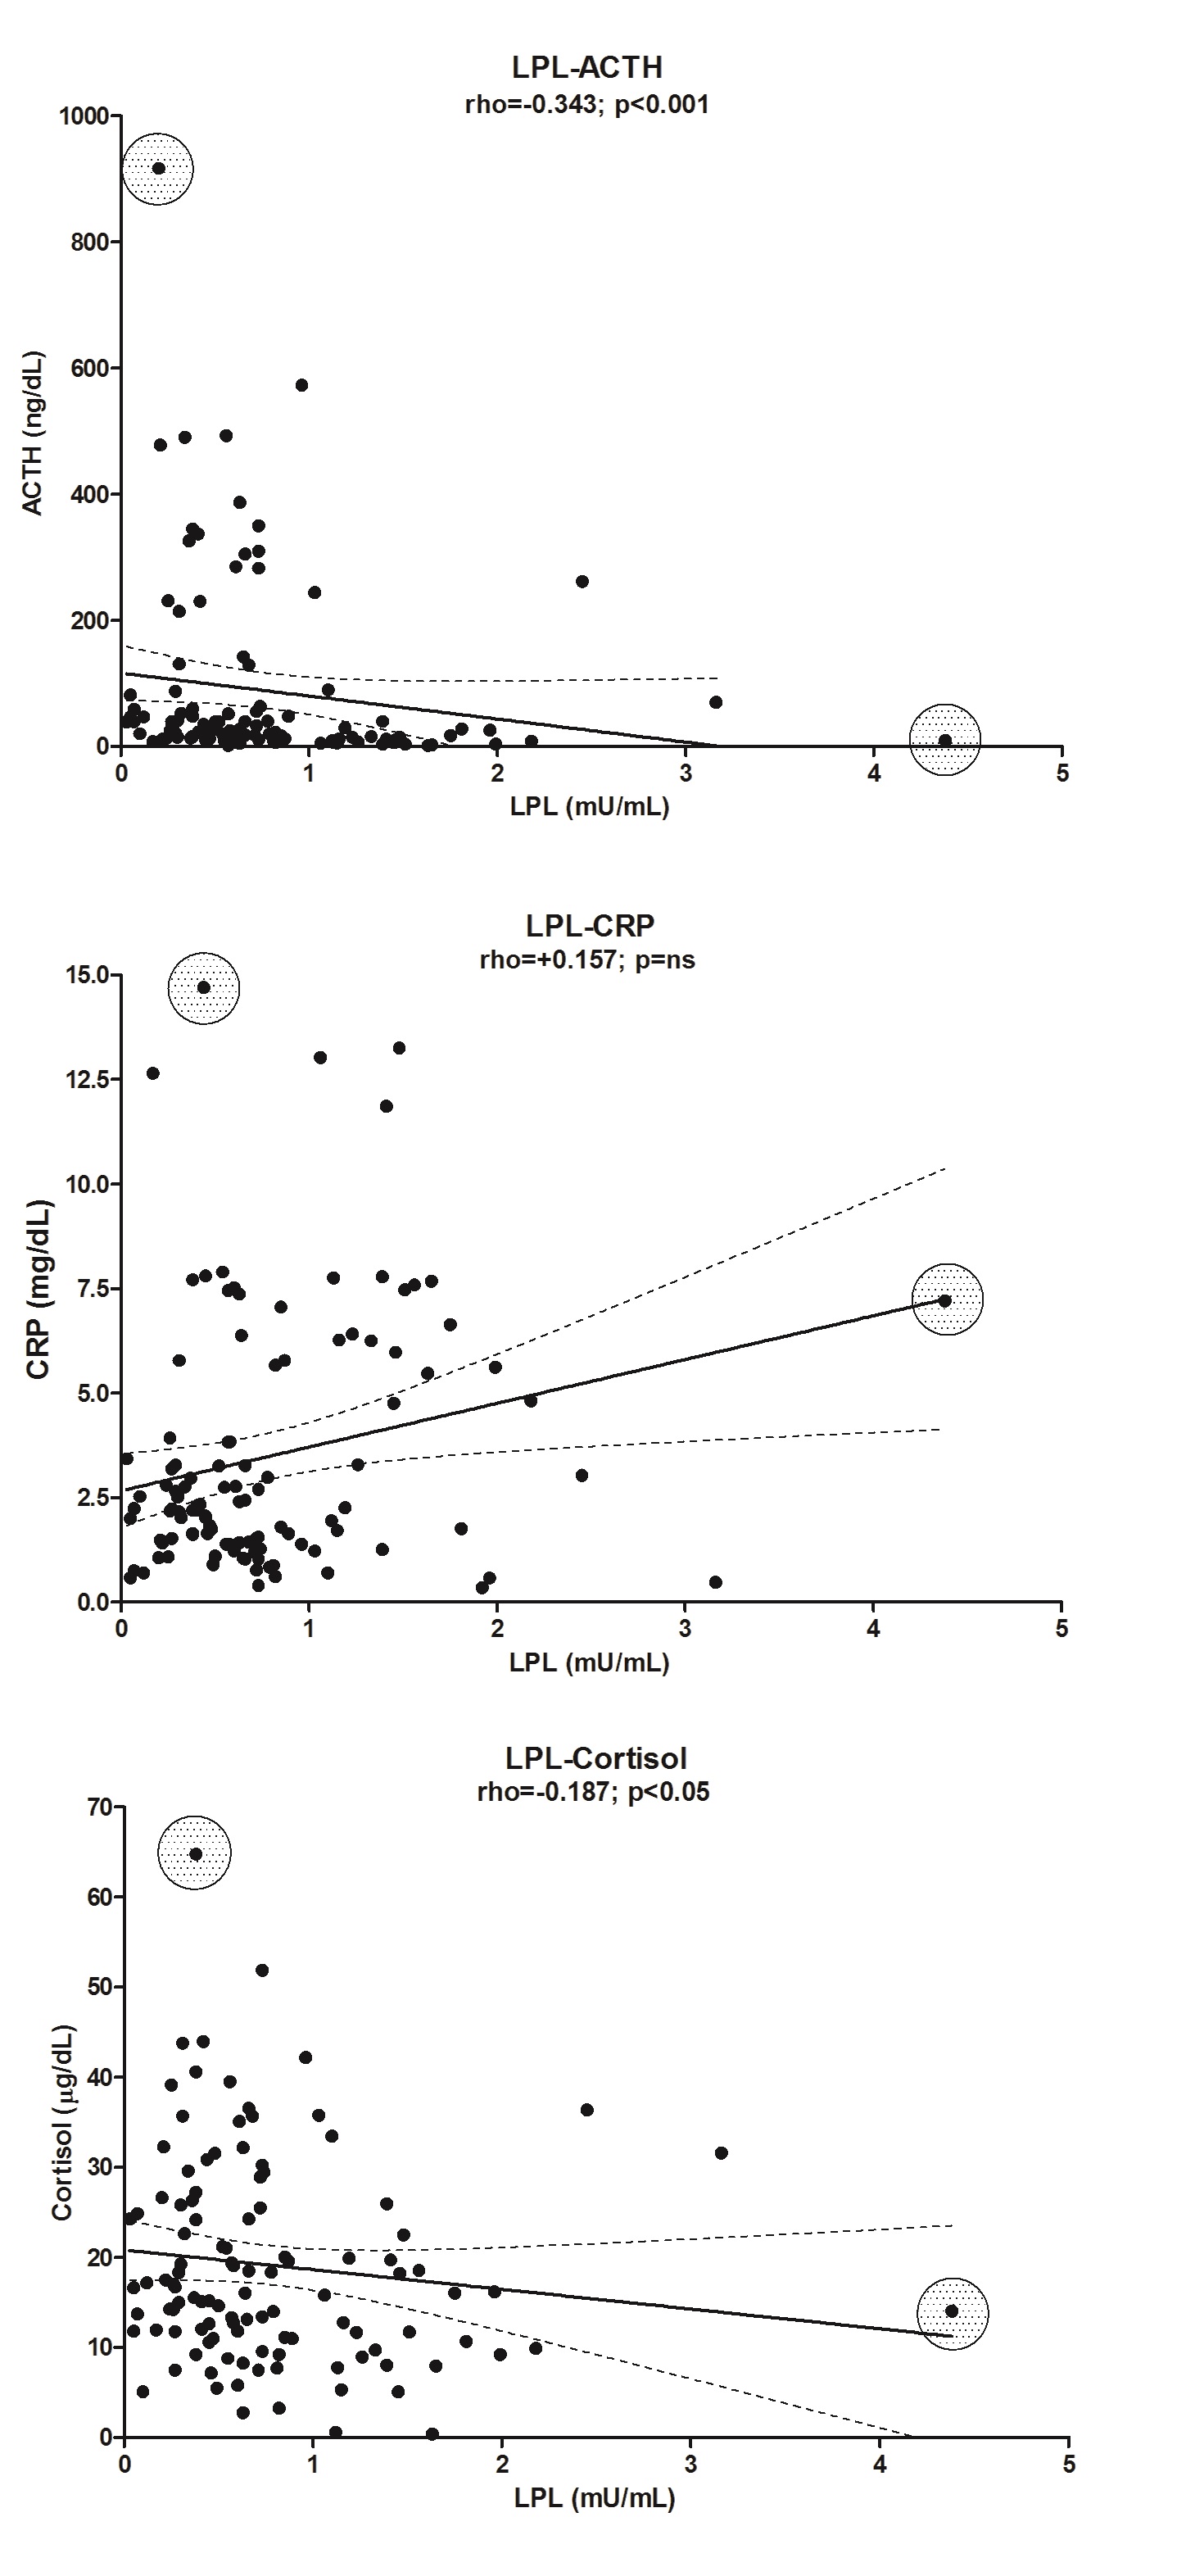
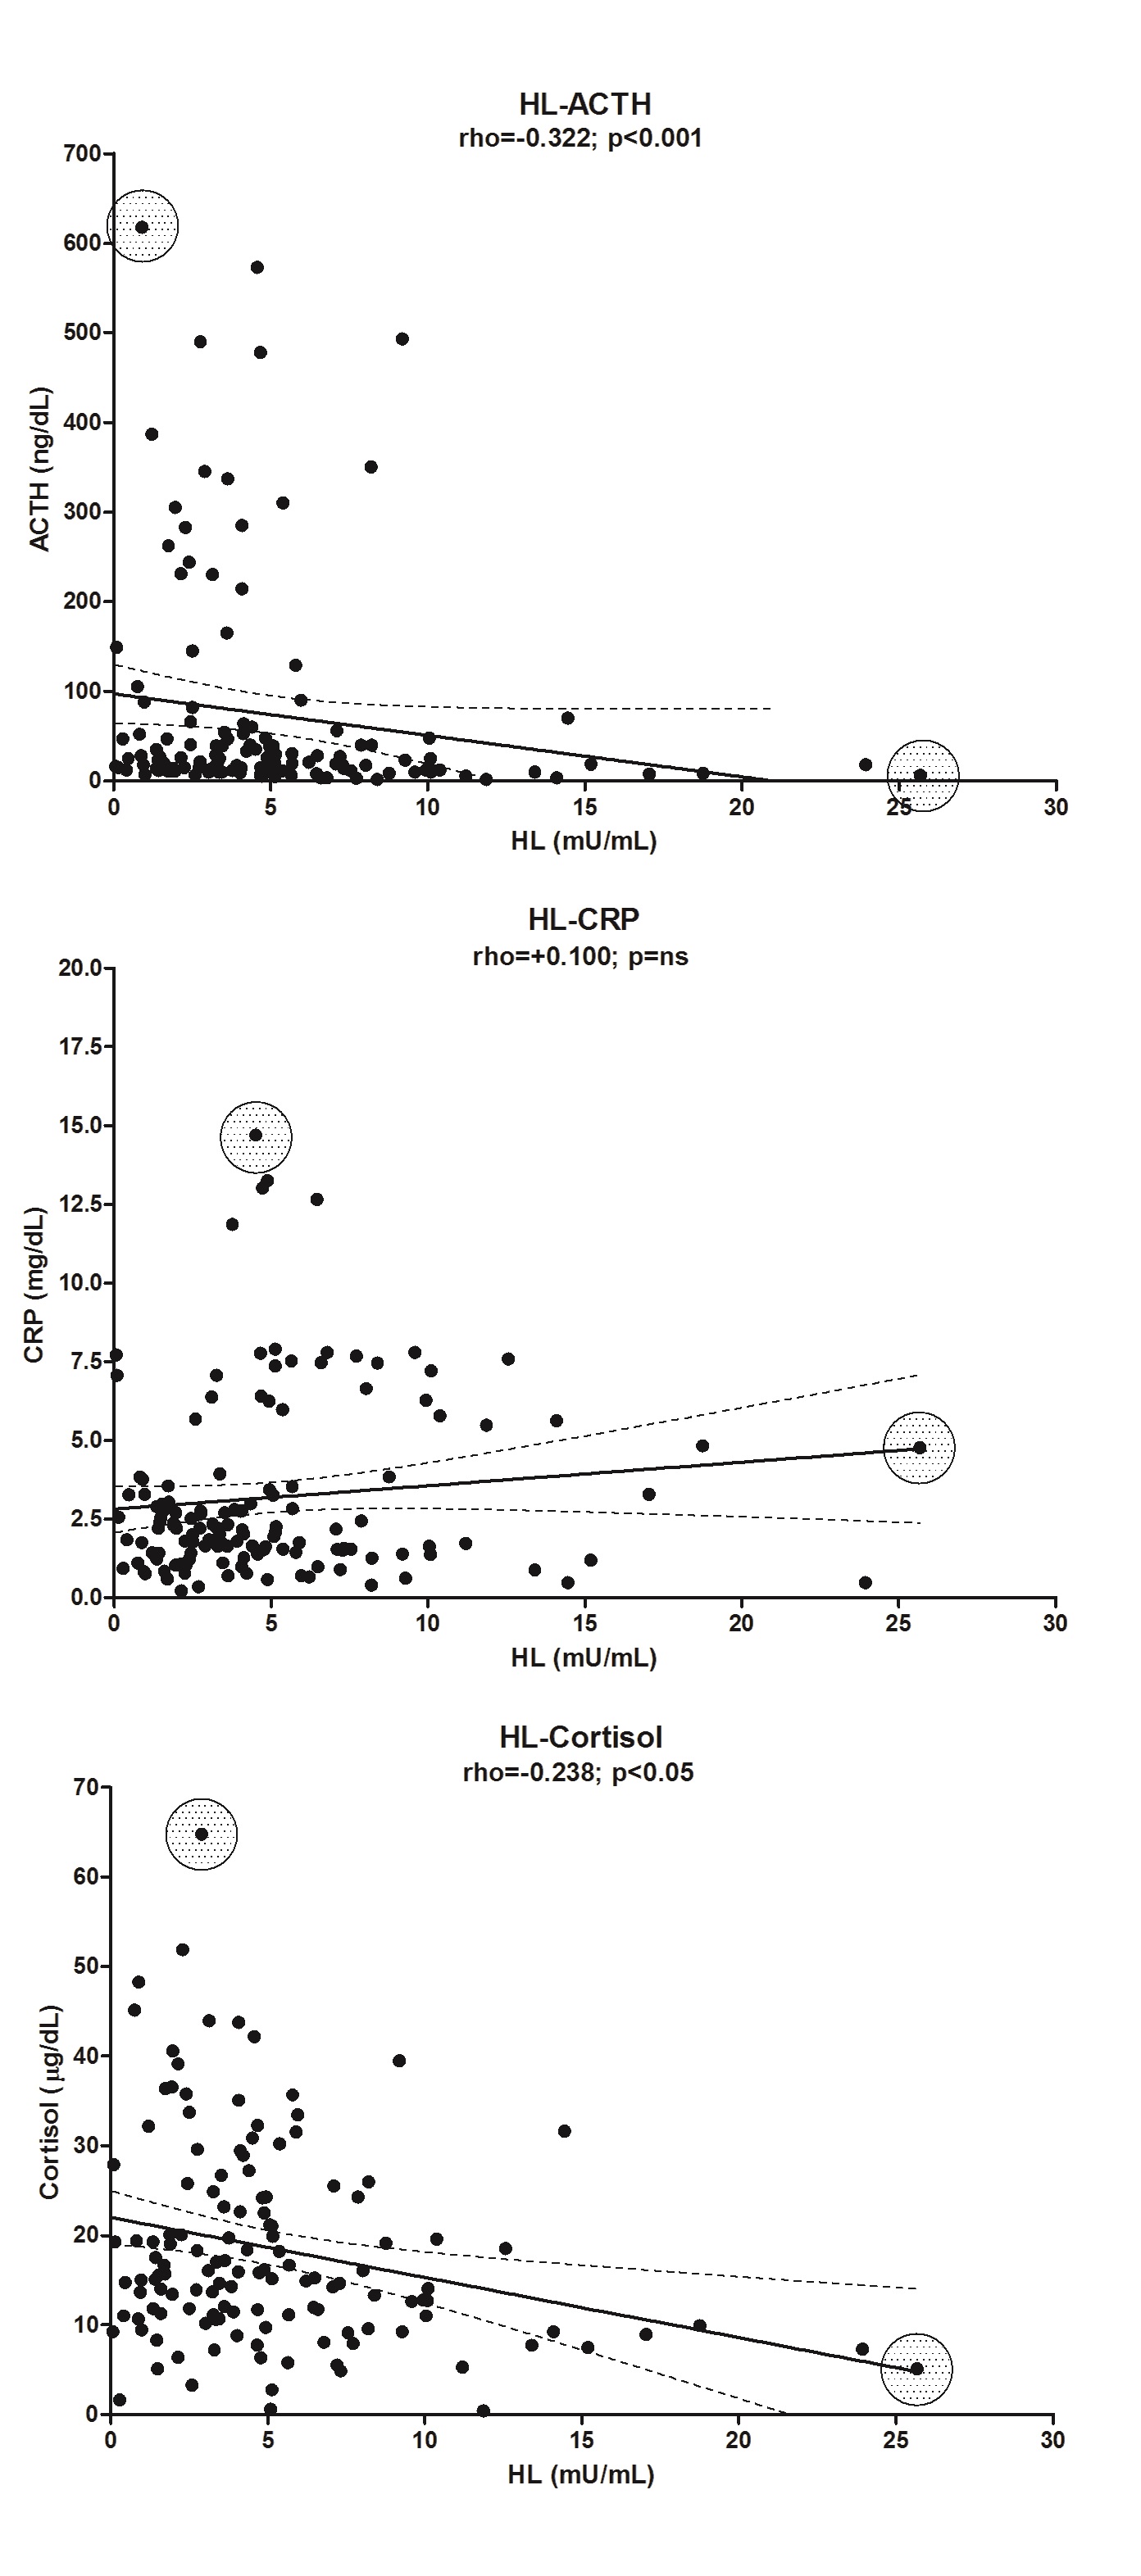
The plasma levels of CRP were significantly elevated 1d after surgery in the OB group (approximately 3.8-fold, P < 0.001), but in the CS group, the increase was 13.5-fold (P < 0.001) (Figure 1, panel C). The values between these two groups are very different (P < 0.001). The enzyme LPL in the CS group was correlated with CRP (rho = 0.401, P < 0.01), but there was no correlation in the C group. Levels of CRP were also negatively correlated (Table 3) with the plasma levels of cortisol, despite the low r value (in the OB group: rho = -0.183, P < 0.05; and in the CS group: rho = -0.383, P < 0.01; there was no correlation in the C group) but also with ACTH (rho = -0.409, P < 0.001), glycerol (rho = -0.412, P < 0.001) and NEFA (rho = -0.321, P < 0.001) in the OB group (Table 3). We are aware that the correlations are low and that their predictive capacity is therefore minimal. However, we preferred not to eliminate the extreme values because they correspond to patients who might be at greater risk than the rest of the patients who are part of the majority group (see Supplementary “Figures 1 and Figure 2”).
Table 1: Clinical and biochemical characteristics of obese patients before and after bariatric surgery.
| Parameters | C | OB | -S | +S | 1 d | 1 M | P (ANOVA) |
|---|---|---|---|---|---|---|---|
| Anthropometrics | |||||||
| Weight (Kg) | 130.3 ± 3.4 | nd | nd | nd | 115.2 ± 3.2 | < 0.0001 | |
| BMI (Kg/m²) | 48.8 ± 0.9 | nd | nd | nd | 42.3 ± 1.6 | < 0.0001 | |
| Glucose metabolism | |||||||
| Insulin (mU/L) | 24.3 ± 2.8 | 20.0 ± 2.9x | 22.2 ± 2.3 | 31.3 ± 3.1*** | 13.9 ± 1.6o | 0.0002 | |
| Glucose (mg/dL) | 100.0 ± 4.0 | 126.3 ± 9.6 | nd | 178.2 ± 12.0ººº,***,ccc,x | 143.0 ± 7.7** | 96.2 ± 3.4 | < 0.0001 |
| HOMA-IR | nd | 7.7 ± 1.1 | nd | 9.2 ± 2.2 | 10.4 ± 1.7** | 3.3 ± 0.5ºº | 0.0006 |
| Lipidmetabolism | |||||||
| Total cholesterol (mg/dL) | 164.3 ± 2.9 | 212.9 ± 7.2ccc | 224.1 ± 12.5***,ccc | 202.2 ± 10.7* | 175.4 ± 15.1ooo | 154.2 ± 7.6ooo | < 0.0001 |
| FC (mg/dL) | 39.2 ± 1.3 | 47.1 ± 6.0 | 44.2 ± 5.1 | 40.3 ± 4.5 | 38.4 ± 6.0 | 40.2 ± 5.0 | ns |
| EC (mg/dL) | 125.1 ± 2.8 | 174.2 ±15.6ccc | 180.0 ± 11.4ccc | 160.0 ± 13.8 | 137.1 ± 14.6 | 143.4 ± 9.8 | < 0.0001 |
| cLDL(mg/dL) | 116.3 ± 5.3 | 136.5 ± 5.4 | 120.6 ± 13.2 | 103.5 ± 11.0o | 85.5 ± 10.4ooo | 91.3 ± 6.8ooo | < 0.0001 |
| cHDL(mg/dL) | 50.2 ± 2.2 | 48.3 ± 1.6 | 35.7 ± 2.9oo,cc | 40.7 ± 3.8 | 38.3 ± 3.5o,c | 33.5 ± 1.2ooo,ccc | < 0.0001 |
| Triglycerides(mg/dL) | 57.8 ± 2.1 | 140.3 ± 8.8ccc | 174.7 ± 36.1ccc | 130.4 ± 27.7ccc | 123.5 ± 20.3ccc | 147.1 ± 10.6ccc | < 0.0001 |
| Phospholipids (mg/dL) | 155.2 ± 3.6 | 195.3 ± 2.8ccc | 189.0 ± 3.3ccc | 180.2 ± 4.0c | 164.2 ± 4.4 o | 166.0 ± 5.0 | < 0.0001 |
| ApoA-I (mg/dL) | 197.5 ± 6.4 | 185.6 ± 5.0 | 165.1 ± 5.0 o,xxx-,***,ccc | 145.5 ± 4.6ooo,s,*,ccc | 133.1 ± 3.7ooo,ccc | 126.4±3.6 ooo,ccc | < 0.0001 |
| ApoA-IV (a.u.) | 110 ± 11 | 100.0 ± 0.0 | 85.8 ± 5.6** | 82.7 ± 7.7* | 73.0 ± 5.9o,cc | 56.8 ± 5.0ooo,ccc | < 0.0001 |
| ApoB (mg/dL) | 68.4 ± 4.9 | 85.1 ± 3.0c | 79.4 ± 3.4o,xxx,*** | 72.5 ± 3.0x | 59.8 ± 2.8ooo | 70.5 ± 3.4o | < 0.0001 |
| Glycerol (μM) | 59.1 ± 11.7 | 199.7 ± 9.5ccc | 220.6 ± 15.2xxx,ccc | 238.6 ± 14.1xxx,ccc | 128.1 ± 10.3 ooo,*** | 218.6 ± 12.4ccc | < 0.0001 |
| NEFA (mM) | 0.29 ± 0.01 | 0.60 ± 0.04ccc | 0.72 ± 0.05x,**,cc | 1.00 ± 0.05ooo,ss,xxx,ccc | 0.54 ± 0.03ccc,*** | 0.95 ± 0.07ooo,ccc | < 0.0001 |
| KB (μM) | 84.6 ± 26.3 | 75.9 ± 13.7 | 80.0 ± 9.6 *** | 229.7 ± 36.7*** | 90.6 ± 17.8*** | 953.8±148 ooo,ccc | < 0.0001 |
The data are expressed as the mean ± SEM. Statistics were computedusing one-way ANOVA and Tukey’s multiple comparison post-tests. Abbreviations: BMI, body mass index; HOMA-IR, homoeostasis model assessment-insulin resistant; FC, free cholesterol; EC, esterified cholesterol; apo, apolipoprotein; NEFA, non-esterified fatty acid; KB, ketone bodies; OB, obese; -S, before surgery; +S, after surgery; 1d, one day after surgery; and 1M, one month after surgery; nd, not determined. Symbols denote the differences between groups: (c) vs C; (º) vs OB; (s) vs –S; (x) vs 1d; (*) vs 1M. One symbol, p < 0.05; two symbols, p < 0.01; three symbols, p < 0.001; ns, non-significant.
Table 2: Relative chemical composition of plasma lipoproteins of obese patients before and after bariatric surgery.
| Parameters | C | OB | -S | +S | 1d | 1M | P(ANOVA) |
|---|---|---|---|---|---|---|---|
| VLDL | |||||||
| Free cholesterol (%) | 3.2 ± 0.5 | 3.6 ± 0.3 | 4.1 ± 0.3 | 3.6 ± 0.4 | 3.5 ± 0.2 | 3.9 ± 0.3 | ns |
| Esterified cholesterol (%) | 6.6 ± 1.0 | 4.2 ± 0.5 | 4.2 ± 0.4 | 4.0 ± 0.6* | 4.2 ± 0.6 | 3.8 ± 0.3 | 0.0281 |
| Triglycerides (%) | 80.4 ± 1.4 | 61.0 ± 2.3ccc | 58.3 ± 1.7ccc | 61.6 ± 3.0ccc | 62.4 ± 2.1ccc | 60.4 ± 2.4ccc | < 0.0001 |
| Phospholipids (%) | 7.9 ± 0.8 | 25.0 ± 2.0ccc | 25.8 ± 1.5ccc | 24.2 ± 2.3ccc | 26.0 ± 1.7ccc | 25.0 ± 2.2ccc | < 0.0001 |
| Protein (%) | 1.9 ± 0.8 | 6.2 ± 0.7 | 7.5 ± 0.7c | 6.6 ± 0.8c | 7.4 ± 0.8c | 6.9 ± 0.8c | 0.0161 |
| Ratio lipid/protein (a.u.) | 22.3 ± 3.2 | 18.7 ± 2.0 | 15.0 ± 1.6 | 21.5 ± 4.7 | 16.1 ± 2.3 | 17.5 ± 2.3 | ns |
| Ratio n/s (a.u.) | 7.6 ± 0.4 | 2.15 ± 0.28ccc | 1.74 ± 0.10ccc | 2.00 ± 0.19ccc | 2.22 ± 0.24ccc | 2.09 ± 0.27ccc | < 0.0001 |
| VLDL mass (% vs OB) | 73.0 ± 13.0 | 100 ± 0 | 137 ± 15c | 153 ± 36c | 102 ± 14 | 100 ± 16 | ns |
| LDL | |||||||
| Free cholesterol (%) | 13.9 ± 1.0 | 7.5 ± 0.3ccc | 7.5 ± 0.4ccc | 6.9 ± 0.4ccc | 7.1 ± 0.4ccc | 7.3 ± 0.4ccc | < 0.0001 |
| Esterified cholesterol (%) | 32.0 ± 1.9 | 19.4 ± 0.8ccc | 19.8 ± 0.9ccc,* | 19.05 ± 0.6ccc | 18.2 ± 0.7ccc | 16.6 ± 0.6ccc | < 0.0001 |
| Triglycerides (%) | 12.3 ± 0.8 | 20.3 ± 1.2 | 22.0 ± 1.4c | 22.6 ± 1.8cc | 23.8 ± 1.6cc | 25.0 ± 1.6ccc | 0.0005 |
| Phospholipids (%) | 27.1 ± 1.8 | 34.2 ± 1.8 | 33.0 ± 1.8 | 33.0 ± 1.7 | 34.3 ± 1.8 | 33.1 ± 1.7 | ns |
| Protein (%) | 14.8 ± 1.2 | 18.7 ± 1.3 | 17.4 ± 1.1 | 18.0 ± 1.4 | 16.6 ± 1.1 | 18.0 ± 1.4 | ns |
| Ratio lipid/protein (a.u.) | 3.0 ± 0.5 | 5.0 ± 0.4 | 5.1 ± 0.3 | 5.2 ± 0.4 | 5.5 ± 0.4 | 5.3 ± 0.5 | ns |
| Ratio n/s (a.u.) | 0.77 ± 0.07 | 0.67 ± 0.03 | 0.74 ± 0.04 | 0.75 ± 0.05 | 0.74 ± 0.04 | 0.73 ± 0.04 | ns |
| LDL mass (% vs OB) | 219 ± 23 | 100 ± 0*** | 162 ± 14ºº,ccc | 148 ± 11cc | 125 ± 12ccc | 140 ± 13ccc | < 0.0001 |
| HDL | |||||||
| Free cholesterol (%) | 4.3 ± 1.1 | 2.3 ± 0.1ccc | 2.0 ± 0.1ccc | 2.5 ± 0.1ccc | 2.5 ± 0.1ccc | 2.2 ± 0.2ccc | < 0.0001 |
| Esterified cholesterol (%) | 16.5 ± 2.4 | 7.2 ± 0.7ccc | 6.4 ± 0.5ccc | 7.8 ± 0.4ccc | 7.7 ± 0.4ccc | 7.5 ± 0.5ccc | < 0.0001 |
| Triglycerides (%) | 3.9 ± 0.5 | 5.2 ± 0.3 | 5.9 ± 0.4 | 6.9 ± 0.5º,cc | 6.4 ± 0.5c | 5.9 ± 0.5 | 0.0094 |
| Phospholipids (%) | 22.1 ± 1.8 | 24.6 ± 2.2 | 24.0 ± 2.1 | 29.9 ± 1.8 | 28.5 ± 2.1 | 26.1 ± 1.9 | ns |
| Protein (%) | 53.1 ± 4.6 | 60.7 ± 3.0 | 61.6 ± 2.7 | 53.0 ± 2.1 | 54.9 ± 2.4 | 58.3 ± 2.7 | ns |
| Ratio lipid/protein (a.u.) | 1.2 ± 0.1 | 0.7 ± 0.1 | 0.7 ± 0.1 | 1.0 ± 0.1 | 0.9 ± 0.1 | 0.8 ± 0.1 | 0.0107 |
| Ratio n/s (a.u.) | 0.22 ± 0.04 | 0.14 ± 0.01cc | 0.14 ± 0.01cc | 0.17 ± 0.01 | 0.16 ± 0.01c | 0.16 ± 0.01c | 0.0060 |
| HDL mass (% vs OB) | 104 ± 7 | 100 ± 0 | 89 ± 3 | 81 ± 5 | 78 ± 5º,c | 79 ± 4 | 0.0014 |
Lipoproteins were isolated by micro-ultracentrifugation from the fasting plasma of obese subjects before and after bariatric surgery at the indicated perioperative phases. The effect of surgery on the relative chemical composition of plasma lipoproteins was determined by comparing the OB values with those obtained at the indicated times after surgery. The data are expressed as the mean ± SEM. Statistics were computedusing oneway ANOVA and Tukey’s multiple comparison post-tests. Abbreviations: HDL, high-density lipoproteins; LDL, low-density lipoproteins; VLDL, very-low-density lipoproteins; ratio n/s, ratio nucleus/surface; OB, obese; -S, before surgery; +S, after surgery; 1 d, one day after surgery; and 1 M, one month after surgery. Symbols denote significant differences between groups: (c) vs C; (º) vs OB; (*) vs 1M. One symbol, p < 0.05; two symbols, p < 0.01; three symbols, p < 0.001; ns, non-significant. In the non-obese stressed (CS) group these parameters were not determined by lack of sample.
Figure 1: Perioperative changes in stress and inflammatory makers in morbidly obese patients undergoing RYGB.
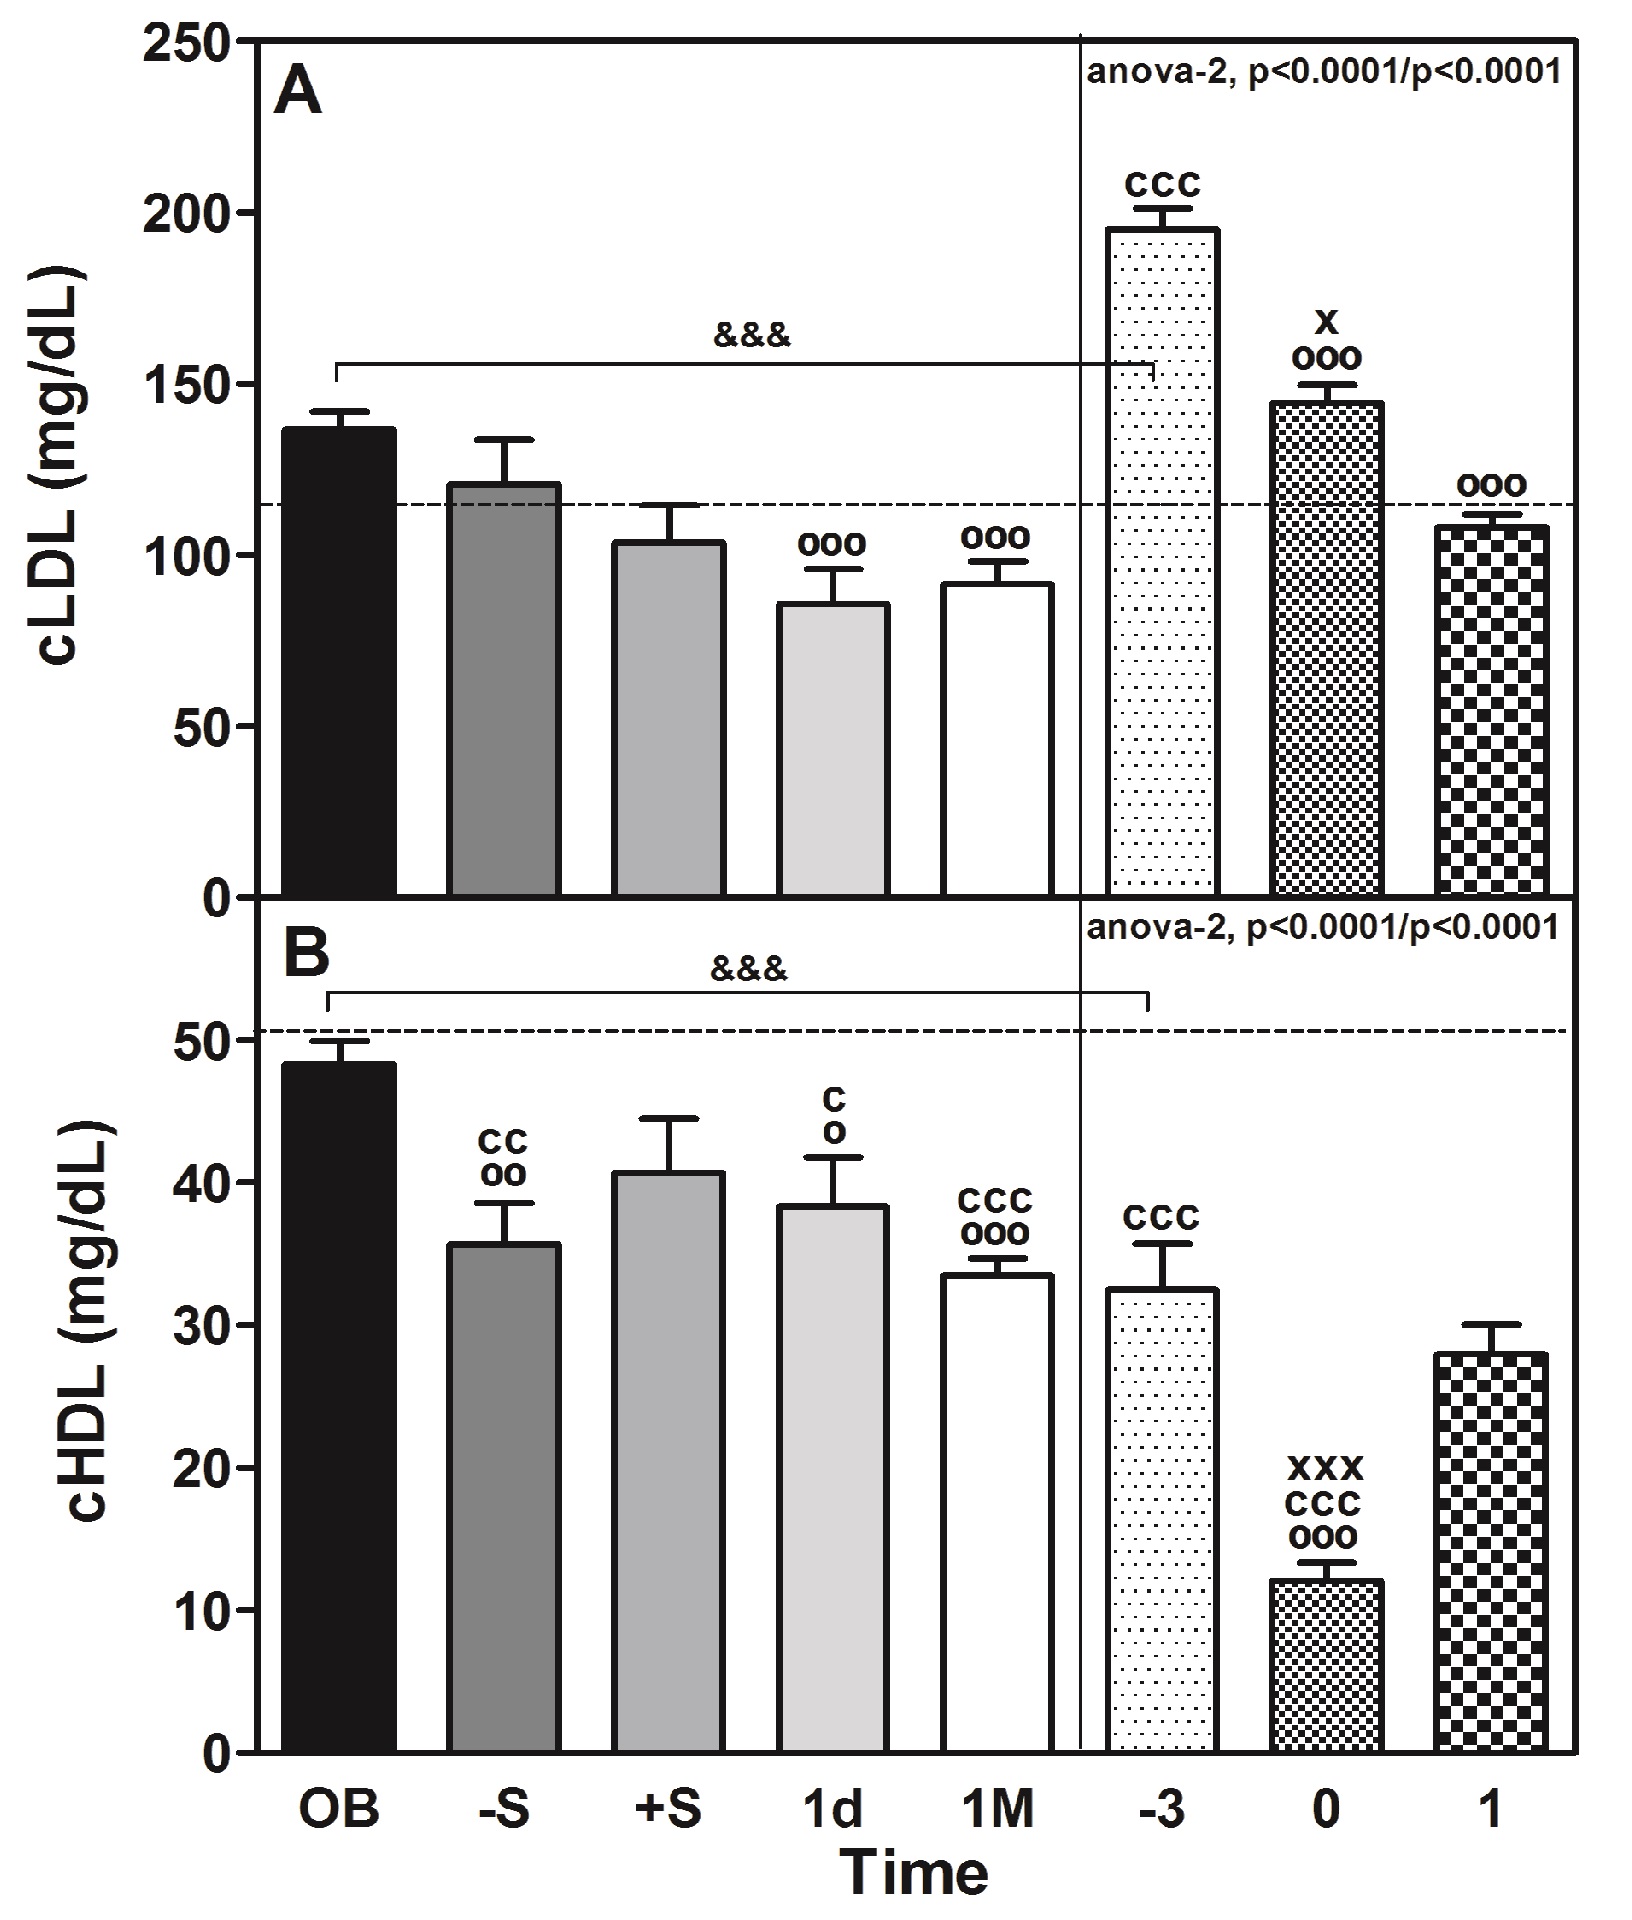
Figure 2: Perioperative changes on cLDL and cHDL in morbidly obese patients undergoing RYGB.
Table 3: Correlation between different plasma parameters in obese patients during before and after bariatric surgery.
| Parameter | Cortisol | CRP | Glucose | Glicerol | KB | ACTH |
|---|---|---|---|---|---|---|
| LPL | -0.211** | 0.190* | -0.255** | -0.331*** | ||
| HL | -0.168* | 0.196* | -0.212* | -0.258*** | -0.277*** | |
| CRP | -0.183* | |||||
| Glucose | 0.376*** | |||||
| Glicerol | -0.412*** | 0.215* | ||||
| KB | 0.333*** | 0.380*** | 0.300*** | |||
| ACTH | 0.703*** | -0.409*** | 0.311*** | 0.242** | ||
| NEFA | 0.326*** | -0.321*** | 0.364*** | 0.530*** | 0.659*** | 0.286*** |
LPL = lipoprotein lipase; HL = hepatic lipase; CRP = C-reactive protein; KB = ketone bodies; ACTH = adrenocorticotropinhormoneand NEFA = non-esterified fatty acids. Correlations were determined by the Multiple Spearman’s correlation coefficient. (*) One symbol, p < 0.05; two symbols, p < 0.01; ns, non-significant. It is noteworthy that none of these correlations were observed in the control (C) group. The values shaded in gray are at the limit (0 - 0.25) of what is considered little or no regression, but indicates a trend. In the non-obese stressed (CS) group there was a negative correlation between cortisol and CRP (r = -0.383, P < 0.01) and positive with glucose (r = 0.301, P < 0.05), the rest of parameters were not determined by lack of sample.
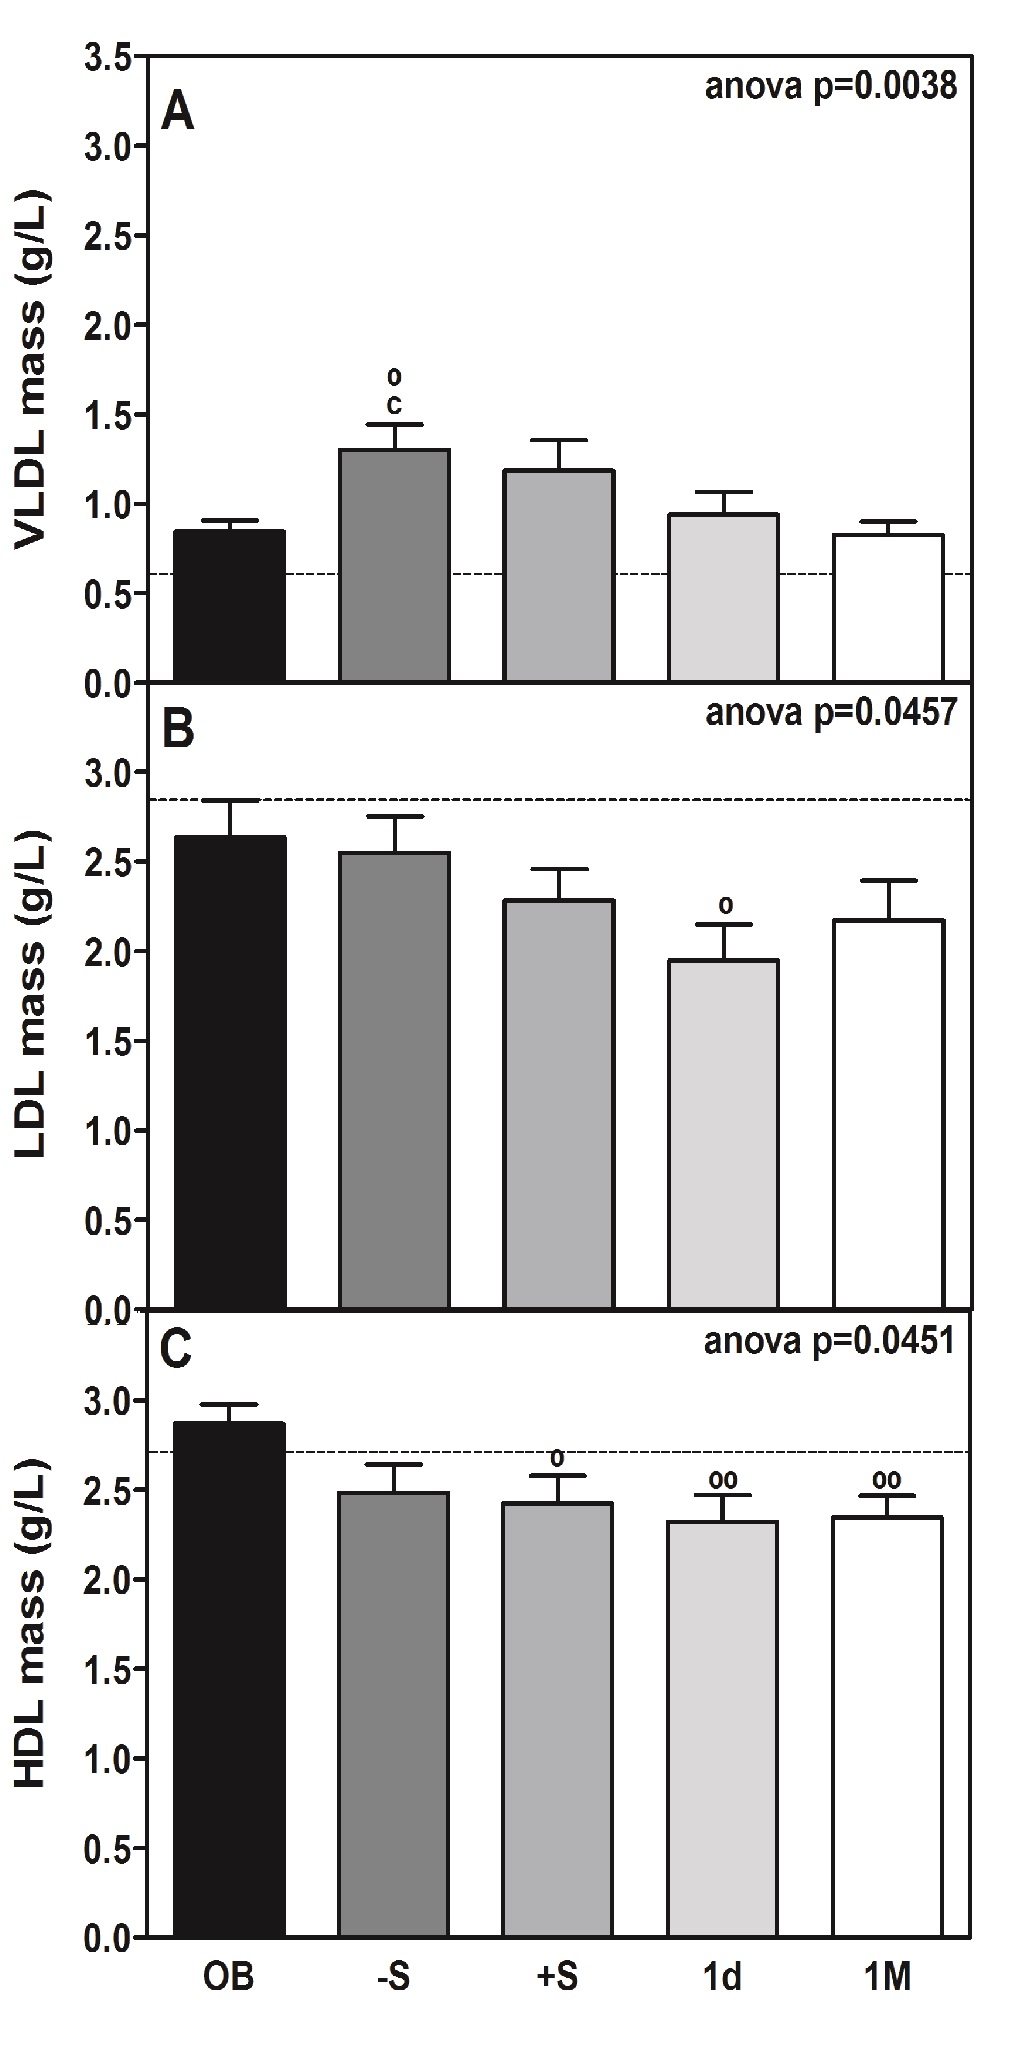
Figure 3: Total circulating mass of VLDL, LDL and HDL lipoproteins in morbidly obese patients undergoing RYGB.
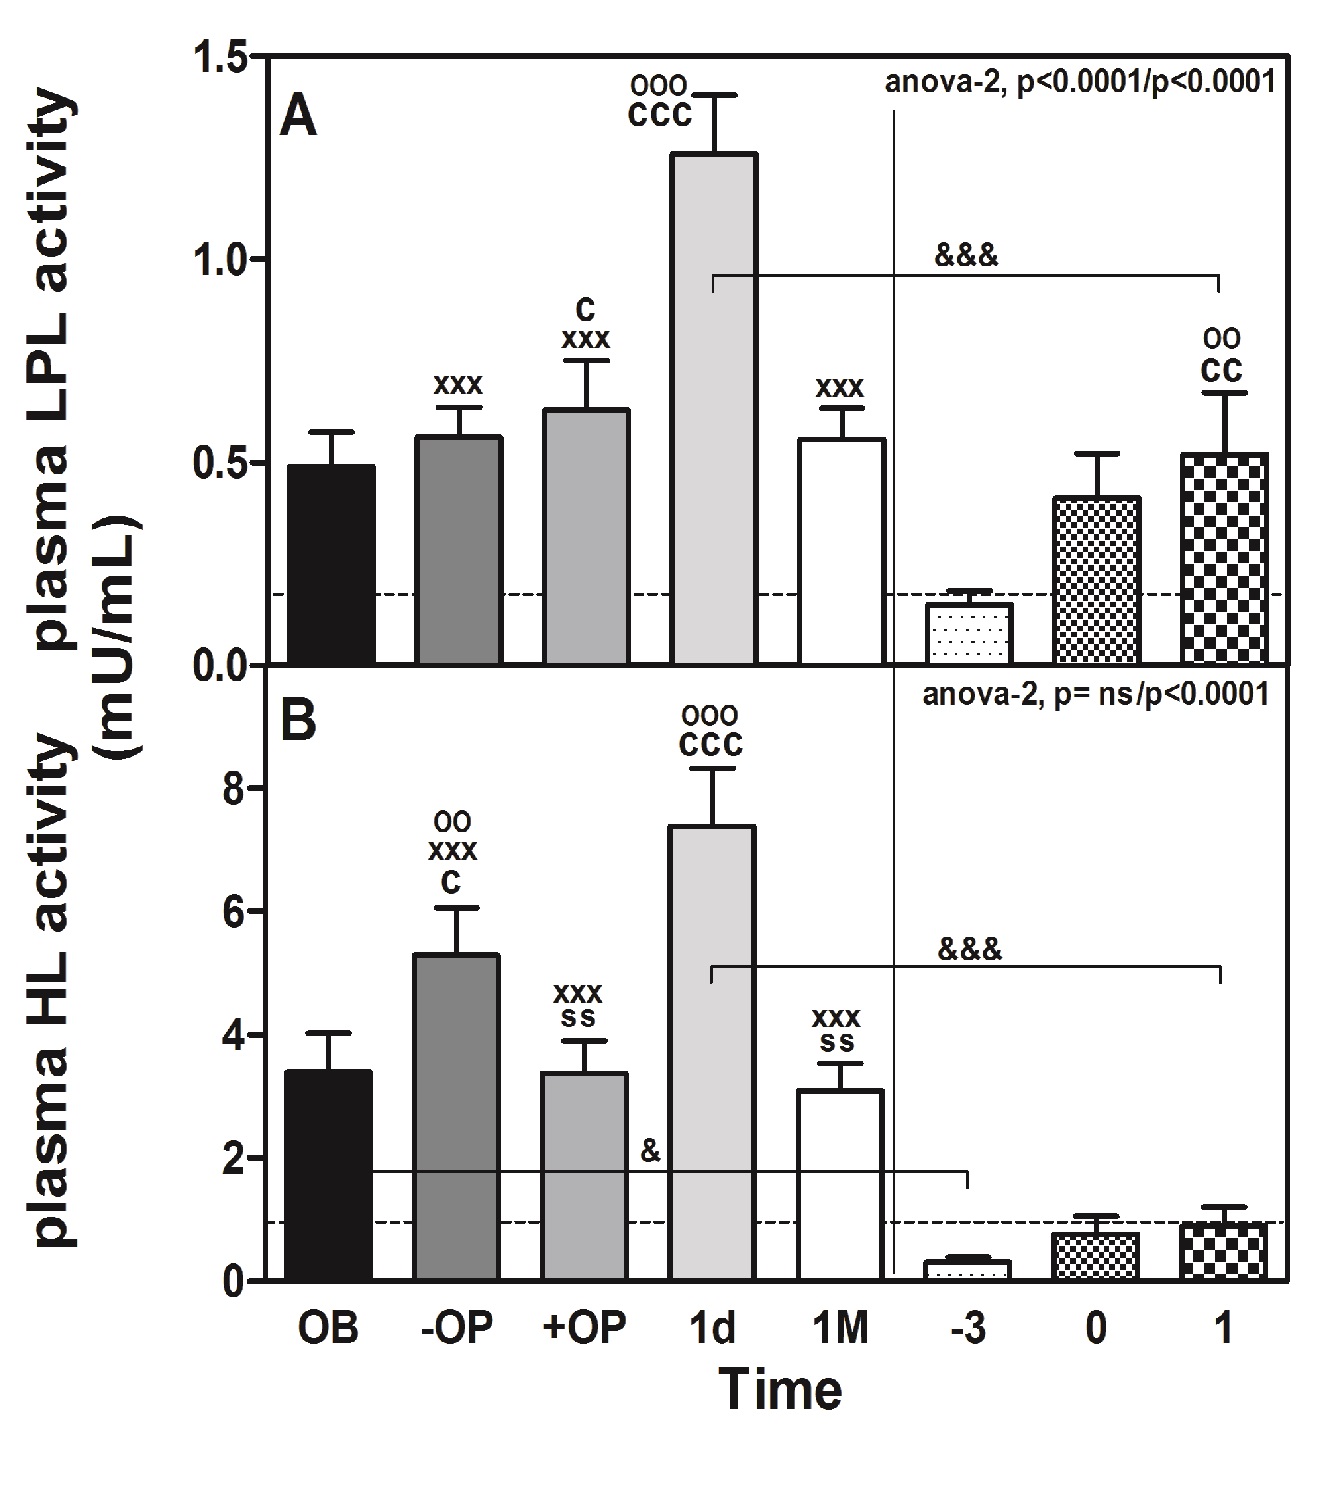
Figure 4: Perioperative changes in plasma lipolytic enzymes in morbidly obese patients undergoing RYGB.
Perioperative impact of RYGB on lipids and lipoproteins
We observed a small but significant (P < 0.0001) increase in total cholesterol, EC and TAG (Table 1) immediately before surgery (-S), but after surgery (+S) and 1d after surgery, the values tended to decline to recover after 1M of surgery, except for total cholesterol. Concomitant with the cholesterol decrease, we observed a significant (P < 0.0001) decline in the plasma levels of cLDL (Table 1 and Figure 2, panel A) and its corresponding cholesterol content (P < 0.0001, Table 2). Supporting this finding, the plasma levels of apoB (approximate decrease of 1.4-fold vs. OB; P < 0.001, Table 1), which is the main protein constituent of VLDL and LDL, and plasma levels of LDL (p < 0.0457) were diminished slightly during the same perioperative period (Tables 1 and 2; and Figure 3, panel B).The cholesterol content also declined significantly (P < 0.0001, Table 2). It should be noted that the cLDL profile of the CS group (Figure 2, panel A) is similar to that of the OB group, except that in the CS group, both before (-3) and surgery (0) are superior (1.4-fold) and in the first case are very significantly (P < 0.001) different.
The decrease in the plasma levels of HDL mass (Figure 3, panel C) vs. OB before and after surgery (11 and 19%, respectively) was identified from the lipid profile (Table 2). At the same time, a significant decrease (P < 0.0001) in the plasma levels of apoA-I (approximate decrease of 23%; P < 0.05 and 13%; p < 0.001, respectively, Table 1), which is the main protein constituent of HDL, was observed. A parallel decrease (27%) in the plasma levels of apoA-IV was also observed, although statistical significance was reached from 1M (43%) onward after intervention (Table 1). Of note, the reduction in plasma HDL (Figure 3, panel C) was maximal at 1d post-surgery (approximately 22% below OB, P < 0.001) and occurred in conjunction with a smallincrease in the relative content of cholesteryl esters and triglycerides contained within the lipoproteins (Table 2). The group of non-obese subjects (CS) had 1.5 times less cHDL (Figure 2, panel B) than the obese patients (OB), and the decrease that occurred with surgery was very significant (P < 0.001) and much more marked (63% in CS and 26% in OB).
The plasma levels of triglycerides in OB reached a peak (approximately 1.2-fold vs. OB, Table 1). That peak was coincident with the plasma level peak of VLDL, which is the main carrier of triglycerides under fasting conditions during the early phase of surgery (Table 2 and Figure 3, panel A). Significant changes in their biochemical composition or size were observed, as predicted by their calculated n/s ratio (Table 2).
Remarkably, the increase in the plasma level of VLDL was also found to be partially associated with a rise in the plasma NEFA level (Table 1), which reached maximum significance at the post-surgery (+S) time-point (approximately 1.7-fold increase; P < 0.001). At pre-surgery time-points, plasma levels of NEFA displayed a trend towards being elevated (approximately 1.4-fold higher). Plasma levels of glycerol paralleled those of NEFA (rho = 0.530, P < 0.001) (Table 3). The transitory increase in the plasma glycerol levels (Table 1) during the perioperative period reached statistical significance and was directly correlated (Table 3) with the plasma levels of ACTH (rho = 0.242, P < 0.01). Additionally, the perioperative pattern of plasma levels of ketone bodies was similar to plasma NEFA levels (rho = 0.608, P < 0.001) (Table 3).
Perioperative impact of RYGB on the plasma levels of lipolytic enzymes
The change in the plasma activities of lipolytic enzymes (LPL and HL) in response to surgery is shown in Figure 4. Both plasma LPL (panel A) and HL (panel B) activities in OB showed a significant peak at 1d after surgery (LPL: 2.6-fold, P < 0.001; HL: 2.2-fold, P < 0.001). That increase was also observed in CS (LPL: 3.5-fold, P < 0.01; HL: 2.9-fold, P = ns). The difference between OB and CS was also highly significant (LPL: 2.4-fold, 1d vs. 1; P < 0.001 and HL: 8.2-fold 1d vs. 1; P < 0.001). In contrast, the plasma LPL mass (data not shown) determined 1d after surgery (40.6 ± 3.1 ng/mL) did not significantly differ from that determined at baseline (44.3 ± 3.3 ng/mL). The peak of plasma LPL activity observed at 1d after surgery coincided with a reduction in the mass/activity ratio of this enzyme, which was approximately 96% lower (P < 0.01) than that calculated at baseline (data not shown). The peak LPL and HL activities were coincident with the time of the CRP peak, just after the cortisol, glucose and ACTH peaked in OB patients. Interestingly, the activities of both plasma lipolytic enzymes were positively correlated only in the OB group (rho = 0.586, P < 0.001) but also with the levels of ACTH, CRP and cortisol (Table 3). We also observed a negative correlation between LPL and HL with different parameters of cholesterol content: LPL with cLDL (rho = -0.312, P < 0.001) and with cHDL (rho = -0.281, P < 0.01). In the case of HL, the correlation was with con cLDL (rho = -0.367, P < 0.001) and with cHDL (rho = -0.322, P < 0.001).
Discussion
The study presented here was performed between 2003 and 2007, when laparoscopy surgery was not a standard technique at our hospital. The study focused only on the obese group (OB) and the changes that occurred in the lipase and lipid parameters before, during and after surgery. The non-obese group (CS) was used only as a surgical stress control, and a detailed study of lipoproteins was not undertaken in that group. Although at present most surgery in the morbidly obese is carried out by laparoscopy or is robotized, in some cases, due to complications, one must resort to open surgery (Schwartz et al., 2004).
On the other hand, in recent years articles have appeared in which both procedures (Nguyen et al., 2000; Nguyen et al., 2002a,b; Zengin et al., 2002) are compared in terms of stress parameters as well as cytokines and other biochemical parameters. After laparoscopic and open RYGB, plasma concentrations of insulin, glucose, epinephrine, dopamine, and cortisol increased, but there was no significant difference in these parameters between groups (Nguyen et al., 2002a). The concentrations of norepinephrine, ACTH, C-reactive protein, and IL-6 also increased, but these levels were significantly (p < 0.05) lower after laparoscopic RYGB than after open RYGB (Nguyen et al., 2002a).
Major surgery is frequently characterized by a string of metabolic, acute phase, and inflammatory responses (Nguyen et al., 2002a; Black, 2003). Acute stress, which is known to occur during the early perioperative phases (first 6 h) of surgery, is frequently characterized by a state of insulin resistance (Schernthaner & Morton, 2008). In our patients, insulin resistance was evidenced by a transient elevation in the plasma levels of glucose and HOMA-IR and an enhanced adrenocortical response promoted by high plasma levels of stress hormones (Lin et al., 2000; Schernthaner& Morton, 2008). Supporting previous data (Nguyen et al., 2002a), in this study, the plasma levels of both ACTH and cortisol peaked during the post-anaesthesia phase and declined the day after surgery. This time-course concurred with the most stressful segment of the intervention, which is the extubation of the patient (Udelsman & Holbrook, 1994). As previously reported (Clearfield, 2005), a significant rise in the levels of CRP, which is frequently associated with the extent of perioperative injury, was observed immediately after the intervention (1d). Simultaneously, the two lipolytic enzymes (LPL and HL) in plasma increased, which has not been described previously. It is noteworthy that the release of these enzymes by the extra hepatic tissues (adipose, muscle) in the case of LPL or the liver in the case of HL is not due to the action of heparin administered during the surgery, but rather a change due to the hormonal action or the regulation of the enzyme itself.
Despite the long-term benefits of bariatric surgery on lipoprotein metabolism (Carpentier & Scruel, 2002; Maruna et al., 2008; Chung et al., 2011), the perioperative time-course of plasma levels of lipids, lipoproteins and metabolic determinants has not been extensively studied. The present work is therefore one of the few studies that has focused on directly dissecting the course of quantitative changes in the main plasma lipoproteins and lipolytic enzymes (LPL and HL) occurring during the immediate perioperative phases of RYGB.
Circulating VLDL was slightly elevated during the pre- and post-anaesthesia stages. Perhaps this small increase could not induce the concomitant elevation in the composition (TAG) of these lipoproteins, despite increasing plasma levels of triglycerides. During this perioperative period, a commensurate increase in plasma NEFA roughly paralleled that of VLDL levels in our study. Therefore, the elevation in the plasma levels of VLDL may be attributed to a stimulation of hepatic VLDL production and secretion. This secretion may result from increased disposal of NEFA by this organ in our postoperative obese patients rather than by decreased lipolysis of these lipoproteins in the plasma (Holm, 2003). Supporting this concept, both insulin resistance (Holm, 2003) and elevated plasma levels of stress hormones (Peckett et al., 2011) promote lipolysis in adipose tissue and lead to enhanced release of NEFA into the plasma and its accumulation in triglycerides in the liver. Moreover, because NEFA are synthesized into ketone bodies in the liver (Goldstein & Elwyn, 1989) the increase in the plasma levels of ketone bodies that occurred in conjunction with the rise in NEFA levels may be further evidence of an increased intake of NEFA by the liver during these perioperative stages. Considering that elevated levels of cortisol also promote the hepatic secretion of apoB (Brindley et al., 1993), the rise in this stress hormone may promote the formation and release of triglycerides in the form of VLDL in our patients.
The subsequent decline in the plasma levels of VLDL was further associated with an elevation in the plasma levels of LPL, a known determinant of the circulating levels of these lipoproteins (Olivecrona & Olivecrona, 2010). Enhanced release of LPL by adipose fat depots in response to inflammation has been described in previous reports in humans (Kientsch-Engel et al., 1982) and experimental animals (Ricart-Jane, et al. 1985).
We have observed the same response to surgical stress in obese and non-obese humans. In both groups, the peak LPL activity (2.6 times higher in the obese) and HL (8.2 times higher in the obese) appeared in plasma, concomitant with increased CRP in plasma (2 times higher in non-obese) one day after surgery, which is preceded by peaks or increments (of similar magnitude in both groups) in glucose, NEFA, cortisol and ACTH (this latter only in the OB group) immediately after surgery and coinciding with extubation.
In a previous study (Sabugal, et al., 1996), we observed that surgery stress after partial hepatectomy in rats produced a peak in LPL activity 6h after surgery. In addition, after acute and/or chronic stress produced by body immobilization, a notable response in both lipid (increase in plasma NEFA and glycerol) and lipoprotein (decrease in plasma TAG and increase in total cholesterol) was observed. These changes suggest that catecholamines and glucocorticoids, which are segregated and synthesized under such conditions, may alter LPL activity directly or indirectly in various tissues (Ricart-Jané, et al. 2002).
Treatment of guinea pigs with an ACTH analogue induced a 12-fold increase in serum cortisol and in LPL mRNA (about two-fold) and LPL activity (Gafvels et al., 1991). ACTH decreases hepatic lipase activity and low-density lipoprotein concentrations in healthy men (Berg et al., 1991); however, in our obese patients, although we observed a significant decrease in LDL and 1.6 times less cLDL 1 d after surgery, the HL increased 2.2-fold. Some authors (Akgun et al., 1998; Kaw & Singh, 2001) have proposed both CRP and IL6 but not lipase as markers of the severity of pancreatitis. We propose that both LPL and HL, such as the typical acute stress markers glucose, ACTH, cortisol and CRP, may serve as indicators of the changes that occur with surgical stress in morbid obesity. Our finding may be the first suggesting these enzymes as potential plasma markers of the acute phase response.
Although the impact of surgery-induced stress on the plasma levels of both LDL and HDL during the perioperative interval is controversial (Nguyen et al., 2002b; Leszczynski et al., 1980; Carpentier & Scruel, 2002; Jahangiri, 2010), it is generally accepted that their plasma levels and properties are influenced by inflammation and the acute phase response (Carpentier & Scruel, 2002; Jahangiri, 2010). Consistent with previous studies (Udelsman & Holbrook, 1994; Akgun et al., 1998) and other types of acute phase reactions, including sepsis (Carpentier & Scruel, 2002; Fitrolaki et al., 2013), the plasma concentration of cholesterol generally parallels a significant reduction in the plasma levels of these lipoproteins.
Although we did not determine the underlying causes of the effect of surgery on the reduction in the circulating levels of these lipoproteins in our postoperative patients, it is reasonable to consider that their metabolism (i.e., the rate they are secreted or cleared) may be somewhat compromised by surgical procedure-related injury. In this regard, the elevation observed in the plasma levels of VLDL immediately before and after intervention may suggest that the production of LDL would be barely augmented at best. Therefore, the observed reduction in the plasma levels of cLDL may result from increased particle clearance via its main receptor, the LDL receptor. Supporting this idea, the expression of this receptor in hepatic cells is induced by inflammatory cytokines (Gierens et al., 2000).
The perioperative RYGB-induced reduction in plasma levels of HDL has been reported extensively (Chimienti et al., 2006 Morinigo et al., 2007). Other authors observed that serum cholesterol and its LDL and HDL fractions are reduced after major surgery, with a significant inverse correlation with peak serum IL-6 levels at 24 hours after surgery (Akgun et al., 1998). The plasma levels of cLDL and cHDL shown in the lipid profile reveal a small but significant decrease. At the same time, our data revealed the presence of predominantly larger lipid-rich particles immediately after surgery (see ratio lipid/protein and n/s in Table 2). Similar to lipoprotein lipase, hepatic lipase was found to increase with CRP. Our data may be the first to reveal an increase in those lipases in the plasma, paralleling that of an acute phase protein that may contribute to the changes in both the composition and the plasma levels of VLDL, LDL and HDL during these perioperative stages.
It is noteworthy that in the perioperative phases of our study, NEFAs are highly sensitive and correlated with the changes that occur in lipases and lipoproteins. It would be interesting to explore this aspect in future research.
We would also like to point out that those patients who show a series of parameters related to stress, such as ACTH, cortisol or glucose, who show extreme values during or immediately after surgery, should be given special care, as it is highly probable that the rest of the metabolic parameters, such as lipids, lipases, and CRP, are also altered and could represent a postoperative risk factor.
One of the limitations of our study was the failure to carry out a study of the lipoprotein composition in the non-obese patients, although this does not invalidate the results obtained.
In conclusion, our data revealed novel perioperative systemic parameters related to lipid and lipoprotein metabolism in different phases of RYGB intervention. In this regard, surgery was associated with unreported changes in some quantitative characteristics of lipases and lipoproteins during the early phases of the intervention. Furthermore, an unreported direct association between the plasma levels of CRP and two main plasma lipolytic enzymes was also identified, thereby suggesting a potential role for these lipases as emerging predictors of the acute phase response.
Conclusion
Acknowledge:
This work was supported by the Ministry of Health and Consumer Affairs, Institute of Health Carlos III (ISCIII) (PI11/01159 and PI15/00190 to JP-O PI15/00332 to JAB-F) and FEDER Funds of the EU (FondoEuropeo de Desarrollo Regional: “Una manera de hacer Europa”). We thank Dr. Miñarro of the Biostatistics Dept. of Biology Fac. (UB) for invaluable help. The English grammar and language have been corrected by American Journal Experts (www.journalexperts.com)
Funding: This work was supported by Ministry of Health and Consumer Affairs, Institute of Health, Carlos III (ISCIII) (PI11/01159 and PI15/00190 to JP-O PI15/00332 to JAB-F) and FEDER Funds of the EU (Fondo Europeo de Desarrollo Regional: “Una manera de hacer Europa”).
Ethics Committee Approval: I certify that a statement confirming that appropriate institutional and/or ethics committee approval has been obtained and is stated in the Methods section of the manuscript.
Conflict of interest: All authors fully declare no financial or other potential conflict of interest.
Nonstandard Abbreviations: RYGB: Roux-En-Y Gastric Bypass; HOMA-IR: Homeostasis Model Assessment of Insulin Resistance; NEFA: Non-Esterified Fatty Acid; TG: Triglycerides; TC: Total Cholesterol; cLDL: LDL Cholesterol; cHDL: HDL Cholesterol; LPL: Lipoprotein Lipase; HL: Hepatic Lipase; CRP: C-reactive Protein
Supplementary Figure 1: Correlation and linear regression between plasma LPL activity and different parameters.
Supplementary Figure 2: Correlation and linear regression between plasma HL activity and different parameters.
References
- 1. Akgun, S., Ertel, N.H., Mosenthal, A., et al. Postsurgical reduction of serum lipoproteins: interleukin-6 and the acute-phase response. (1998) J Lab Clin Med 131(1): 103-108.
Pubmed || Crossref - 2. Armario, A., Marti, J., Gil, M. The serum glucose response to acute stress is sensitive to the intensity of the stressor and to habituation. (1990) Psychoneuroendocrinology 15(5-6): 341-347.
Pubmed || Crossref - 3. Ay, L., Kopp, H.P., Brix, J.M., et al. Thrombin generation in morbid obesity: significant reduction after weight loss. (2010) J Thromb Haemost 8(4): 759-765.
Pubmed || Crossref - 4. Ballart, X., Siches, M., Peinado-Onsurbe, J., et al. Isoproterenol increases active lipoprotein lipase in adipocyte medium and in rat plasma. (2003) Biochimie 85(10): 971-982.
Pubmed || Crossref - 5. Berg, A.L., Hansson, P., Nilsson-Ehle, P. ACTH decreases hepatic lipase activities and low density lipoprotein concentrations in healthy men. (1991) J Intern Med 229(2): 201-203.
Pubmed || Crossref - 6. Black, P.H. The inflammatory response is an integral part of the stress response: Implications for atherosclerosis, insulin resistance, type II diabetes and metabolic syndrome X. (2003) Brain Behav Immun 17(5): 350-364.
Pubmed || Crossref - 7. Brindley, D.N., McCann, B.S., Niaura, R., et al. Stress and lipoprotein metabolism: modulators and mechanisms. (1193) Metabolism 42(9): 3-15.
Pubmed || Crossref - 8. Carpentier, YA., Scruel, O. Changes in the concentration and composition of plasma lipoproteins during the acute phase response. (2002) Curr Opin Clin Nutr Metab Care 5(2): 153-158.
Pubmed || Crossref - 9. Chimienti, G., Aquilino, F., Rotelli, M.T., et al. Lipoprotein(a), lipids and proinflammatory cytokines in patients undergoing major abdominal surgery. (2206) Br J Surg 93(3): 347-353.
Pubmed || Crossref - 10. Chung, M.Y., Hong, S.J., Lee, J.Y. The influence of obesity on postoperative inflammatory cytokine levels. (2011) J Int Med Res 39(6): 2370-2378.
Pubmed || Crossref - 11. Clearfield, M.B. C-reactive protein: a new risk assessment tool for cardiovascular disease. (2005) J Am Osteopath Assoc 105(9): 409-416.
Pubmed - 12. Ehnholm, C., Kuusi, T. Preparation, characterization, and measurement of hepatic lipase. (1986) Methods Enzymol 129: 716-738.
Pubmed || Crossref - 13. Fitrolaki, D.M., Dimitriou, H., Kalmanti, M., et al. CD64-Neutrophil expression and stress metabolic patterns in early sepsis and severe traumatic brain injury in children. (2013) BMC Pediatr 13: 31-41.
Pubmed || Crossref - 14. Gåfvels, M., Vilaró, S., Olivecrona, T. Lipoprotein lipase in guinea-pig adrenals: activity, mRNA, immunolocalization and regulation by ACTH. (1991) J Endocrinol 129(2): 213-220.
Pubmed || Crossref - 15. Gierens, H., Nauck, M., Roth, M., et al. Interleukin-6 stimulates LDL receptor gene expression via activation of sterol-responsive and Sp1 binding elements. (2000) Arterioscler Thromb Vasc Biol 20(7): 1777-1783.
Pubmed || Crossref - 16. Goldstein, S.A., Elwyn, D.H. The effects of injury and sepsis on fuel utilization. (1989) Annu Rev Nutr 9: 445-473.
Pubmed || Crossref - 17. Holm, C. Molecular mechanisms regulating hormone-sensitive lipase and lipolysis. (2003) Biochem Soc Trans 31(Pt 6): 1120-1124.
Pubmed || Crossref - 18. Hultin, M., Olivecrona, G., Olivecrona, T. Effect of protamine on lipoprotein lipase and hepatic lipase in rats. (1994) Biochem J 304(3): 959-966.
Pubmed || Crossref - 19. Jahangiri A. High-density lipoprotein and the acute phase response. (2010) Curr Opin Endocrinol Diabetes Obes 17(2): 156-160.
Pubmed || Crossref - 20. Julve, J., Pardina, E., Perez-Cuellar, M., et al. Bariatric surgery in morbidly obese patients improves the atherogenic qualitative properties of the plasma lipoproteins. (2014) Atherosclerosis 234(1): 200-205.
Pubmed || Crossref - 21. Kaw, M., Singh, S. Serum lipase, C-reactive protein, and interleukin-6 levels in ERCP-induced pancreatitis. (2001) Gastrointest Endosc 54(4): 435-440.
Pubmed || Crossref - 22. Kientsch-Engel, R.I., Siess, E.A., Wieland, O.H. Measurement of ketone bodies in subcellular fractions using a spectrophotometric iron-chelate assay. (1982) Anal Biochem 123(2): 270-275.
Pubmed || Crossref - 23. Lin, E., Calvano, S.E., Lowry, S.F. Inflammatory cytokines and cell response in surgery. (2000) Surgery 127: 117-126.
- 24. Maruna, P., Gurlich, R., Rosicka, M. Ghrelin as an acute-phase reactant during postoperative stress response. (2008) Horm Metab Res 40(6): 404-409
Pubmed || Crossref - 25. Matthews, D.R., Hosker, J.P., Rudenski, A.S., et al. Homeostasis model assessment: insulin resistance and beta-cell function from fasting plasma glucose and insulin concentrations in man. (1985) Diabetologia 28(7): 412-419.
Pubmed || Crossref - 26. McCoy, M.G., Sun, G.S., Marchadier, D., et al. Characterization of the lipolytic activity of endothelial lipase. (2002) J Lipid Res 43(6): 921-929.
Pubmed - 27. Morinigo, R., Casamitjana, R., Delgado, S., et al. Insulin resistance, inflammation, and the metabolic syndrome following Roux-en-Y gastric bypass surgery in severely obese subjects. (2007) Diabetes Care 30(7): 1906-1908.
Pubmed || Crossref - 28. NCEP. Executive Summary of The Third Report of The National Cholesterol Education Program (NCEP) Expert Panel on Detection, Evaluation, And Treatment of High Blood Cholesterol In Adults (Adult Treatment Panel III). (2001) JAMA 285: 2486-2497.
Pubmed || Crossref - 29. Nguyen, N.T., Ho, H.S., Palmer, L.S., et al. A comparison study of laparoscopic versus open gastric bypass for morbid obesity. (2000) J Am Coll Surg 191: 149-157.
Pubmed || Crossref - 30. Nguyen, N.T., Goldman, C.D., Ho, H.S., et al. Systemic stress response after laparoscopic and open gastric bypass. (2002a) J Am CollSurg 194(5): 557-566.
Pubmed || Crossref - 31. Nguyen, N.T., Wolfe, B.M. Laparoscopic versus open gastric bypass. (2002) Semin Laparosc Surg 9(2): 86-93.
Pubmed || Crossref - 32. Olivecrona, G., Olivecrona, T. Triglyceridelipases and atherosclerosis. (2010) Curr Opin Lipidol 21(5): 409-415.
Pubmed || Crossref - 33. Pardina, E., Baena-Fustegueras, J.A., Catalan, R., et al. Increased expression and activity of hepatic lipase in the liver of morbidly obese adult patients in relation to lipid content. (2009a) Obes Surg 19: 894-804.
Pubmed || Crossref - 34. Pardina, E., Lopez-Tejero, M.D., Llamas, R., et al. Ghrelin and apolipoprotein AIV levels show opposite trends to lept in levels during weight loss in morbidly obese patients. (2009) Obes Surg 19(7): 1414-1423.
Pubmed || Crossref - 35. Peckett, A.J., Wright, D.C., Riddell, M.C. The effects of glucocorticoids on adipose tissue lipid metabolism. (2011) Metabolism 60(11): 1500-1510.
Pubmed || Crossref - 36. Ricart-Jane, D., Cejudo-Martin, P., Peinado-Onsurbe, J., t al. Changes in lipoprotein lipase modulate tissue energy supply during stress. (1985) J Appl Physiol 99(4): 1343-1351.
Pubmed || Crossref - 37. Ricart-Jané, D., Rodríguez-Sureda, V., Benavides, A., et al. Immobilization stress alters intermediate metabolism and circulating lipoproteins in the rat. (2002) Metabolism 51(7): 925-931.
Pubmed || Crossref - 38. Rodriguez-Sureda, V., Julve, J., Llobera, M., et al. Ultracentrifugation micromethod for preparation of small experimental animal lipoproteins. (2002) Anal Biochem 303(1): 73-77.
Pubmed || Crossref - 39. Sabugal, R., Robert, M.Q., Julve, J., et al. Hepatic regeneration induces changes in lipoprotein lipase activity in several tissues and its re-expression in the liver. (1996) Biochem J 318(2): 597-602.
Pubmed || Crossref - 40. Schernthaner, G., Morton, J.M. Bariatric surgery in patients with morbid obesity and type 2 diabetes. (2008) Diabetes Care 31: 297-302.
Pubmed || Crossref - 41. Schwartz, M.L., Drew, R.L., Chazin-Caldie, M. Factors determining conversion from laparoscopic to open Roux-en-Y gastric bypass. (2004) Obes Surg 14(9): 1193-1197.
Pubmed || Crossref - 42. Seematter, G., Binnert, C., Martin, J.L., et al. Relationship between stress, inflammation and metabolism. (2004) Curr Opin Clin Nutr Metab Care 7(2): 169-173.
Pubmed || Crossref - 43. Udelsman, R., Holbrook, N.J. Endocrine and molecular responses to surgical stress. (1994) Curr Probl Surg 31(8): 653-720.
Pubmed || Crossref - 44. Williams, D.B., Hagedorn, J.C., Lawson, E.H., et al. Gastric bypass reduces biochemical cardiac risk factors. (2007) Surg Obes Relat Dis 3(1): 8-13.
Pubmed || Crossref - 45. Zengin, K., Taskin, M., Sakoglu, N., et al. Systemic inflammatory response after laparoscopic and open application of adjustable banding for morbidly obese patients. (2002) Obes Surg 12(2): 276-279.
Pubmed || Crossref


