Spectroscopic and molecular modcking analysis of the interaction between Trypsin and Cefpirome
Jinju Wang, Baosheng Liu*, Gang Bian, Shaotong Duan, Mengmeng Cui
Affiliation
Key Laboratory of Analytical Science and Technology of Hebei Province, College of Chemistry & Environmental Science, Hebei University, Baoding 071002, Hebei Province, P. R. China
Corresponding Author
Baosheng Liu, Key Laboratory of Analytical Science and Technology of Hebei Province, College of Chemistry & Environmental Science, Hebei University, Baoding 071002, Hebei Province, P. R. China, Tel: +86-312-5079385, Fax: +86-312-5079525; E-mail: lbs@hbu.edu.cn
Citation
Liu, B., et al. Spectroscopy and Molecular Docking Analysis of the Interaction between Trypsin and Cefpirome. (2017) J Anal Bioanal Sep Tech 2(1): 67- 74.
Copy rights
© 2017 Liu, B. Sams. This is an Open access article distributed under the terms of Creative Commons Attribution 4.0 International License.
Keywords
Trypsin; Cefpirome; multi-spectroscopy methods; molecular docking; cooperativity
Abstract
The interaction between Cefpirome and Trypsin was studied using multi-spectroscopy and molecular docking methods. The results showed that quenching mechanism of the Trypsin-Cefpirome system was probably static. The main interaction force was electrostatic force, and the number of binding sites in this system was approximately equal to 1. The quenching curves indicated that the tyrosine and tryptophan residues were both involved in the reaction. Synchronous fluorescence spectroscopy further confirmed that the main binding site was closer to tryptophan residues. The distance (r) between Trypsin and Cefpirome was less than 7 nm, which indicated that the energy transfer from Trypsin to Cefpirome was non-radiative energy transfer. The values of the Hill’s coefficients showed that there was negative cooperativity in the interaction between Cefpirome and Trypsin.
Introduction
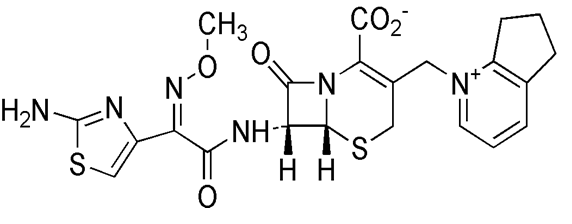
Cefpirome sulfate is a kind of the fourth generation, semi-synthetic, broad-spectrum cephalosporin antibiotic. It is white and pale yellowish crystalline powder with specific smell. Also, it is soluble in water and practically insoluble in ethanol[1]. The molecular weight of this drug is 612.67 and the molecular formula is C22H22N6O5S2•H2SO4[2]. It has wide antibacterial activity against Gram-positive and Gram-negative bacteria, especially against Enterobacteriaceae, Staphylococcus aureus, and Staphylococcus epidermidis as well as Pseudomonas and aeruginosa. This antibacterial agent is suitable for the treatment of infections. Its structure was shown in the Figure 1.
Proteinases play important roles in many relevant biological processes and are attractive targets in pharmaceutical research. Trypsin (EC 3.4.21.4) is an important proteinase in the digestive system and plays an important role in many physiological processes[3]. It is a potential target in the blood coagulation system and an important protein model to study ligand-protein interactions[4]. It is a proteolytic enzyme having four tryptophans (Trp51, Trp141, Trp215, and Trp237) that can be used as intrinsic fluorophores, and its molecular weight is 23.3 kDa[5]. It can be found in digestive tracts of animals, insects and microorganisms. Trypsin is associated with some disorders such as platelet aggregation, cystic fibrosis, pancreatitis, acute abdominal disorders[6].
Nowadays, in order to improve the efficacy and reduce side effects of drugs, targeted drug delivery and targeted therapy of cells have already aroused extensive interest. Potential applications of drug point and directional transport system, such as the ligand-receptor mediated transport, are being explored. In this paper, multi-spectroscopy methods were used to explore the interaction mechanism between Trypsin and Cefpirome. This study is expected to provide important insight into the interaction of Trypsin and Cefpirome on physiological conditions. And studying the interaction of Trypsin-Cefpirome system from different perspectives may help us search for more particular information concerning the transport and distribution of Cefpirome in the human body. In addition, it is necessary to understand the structure and function of Trypsin, and it is the prerequisite and foundation of modification and design of drug molecules. Moreover, it also contributes to targeted drug delivery of cephalosporin.
Figure 1: The molecular structure of Cefpirome.
Experimental
Apparatus
All fluorescence spectra were recorded with a Shimadzu RF-5301PC spectrofluorophotometer. Absorption was measured with an UV-Vis recording spectrophotometer (UV-265, Shimadzu, Japan). Circular dichroism spectra were recorded on a MOS-450/SFM300 circular dichroism spectrometer (Bio-Logic, France). All pH measurements were carried out with a pHS-3C precision acidity meter (Leici, Shanghai, China). All temperatures were controlled by a SYC-15B superheated water bath (Nanjing Sangli Electronic Equipment Factory, Nanjing, China).
Materials
Cefpirome was the purity grade inferior of 98.5%. Trypsin was purchased from Sigma-Aldrich (purity grade inferior 98.5%). Stock solutions of Trypsin (4.0 × 10⁻⁵ M) and Cefpirome (1.0 × 10⁻³ M) were prepared. All the stock solutions were further diluted as working solutions prior to use. Tris-HCl buffer solution containing NaCl (0.15 M) was used to keep the pH of the solution at 7.40, and NaCl solution was used to maintain the ionic strength of the solution. All other reagents were of analytical grade, and all aqueous solutions were prepared with fresh double-distilled water and stored at 277 K.
Elimination of the inner filter effects
To eliminate the inner filter effects, the fluorescence intensities were corrected for the absorption of excitation light and re-absorption of emitted light to decrease the inner filter using the following relationship[7]:
Fcor = Fobs x e(Aex + Aem)/2 (1)
Where, Fcor and Fobs are the fluorescence intensities corrected and observed, respectively. Aex and Aem are the absorbance of Cefpirome at excitation and emission wavelengths, respectively.
Procedures
Fluorescence measurements
In a typical fluorescence measurement, 0.5 mL Tris-HCl (pH = 7.40), 0.5 mL Trypsin solution (4.0 × 10⁻⁵ M) and different concentrations of Cefpirome were added into 10 mL colorimetric tube successively. The samples were diluted to 5.0 mL with double-distilled water, mixed thoroughly by shaking, and kept static for 40 min at different temperatures (298, 303 and 310 K). The excitation wavelength for Trypsin was 280 nm and 295 nm, respectively, with a 1.0 cm path length cell. The excitation and emission slits were set at 5 nm. The solution was subsequently scanned on the fluorophotometer and the fluorescent intensity of the system was recorded.
Synchronous fluorescence measurements
Solution preparation was as detailed above. The fluorescence spectra of the Trypsin-Cefpirome system were recorded when the Δλ value between the excitation and emission wavelengths was stabilized at 15 and 60 nm, respectively.
1.0 mL Tris-HCl (pH = 7.40), 1.0 mL Trypsin solution (4.0 × 10⁻⁵ M) and different concentrations of Cefpirome were added into 10 mL colorimetric tube successively. The reference was different concentrations of Cefpirome solution. The samples were diluted to 5.0 mL with double-distilled water, mixed thoroughly by shaking, and kept static for 40 min at 298 K. The UVVis absorption spectra of Trypsin in the presence and absence of Cefpirome were recorded with 1.0 cm quartz cells in the range from 190 nm to 350 nm.
Molecular docking study
The crystal structure of Trypsin (PDB ID:2PTN) was obtained from the Protein Data Bank, Structural formula of the Cefpirome in Chemdraw Pro 14.0 software, At the same time in the Chembio 3D Ultra 14.0 software to optimize the energy of its three-dimensional structure[8,9]. Finally use Auto Dock 4.2.6 software to molecular docking of Cefpirome and Trypsin, application of Lamarck (LGA) genetic algorithm to calculate the combined with protein drug molecules possible conformation.
Results and Discussion
Fluorescence quenching of Trypsin by Cefpirome
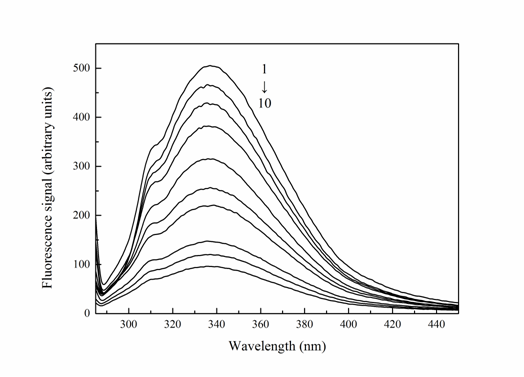
Fluorescence quenching measurement is an effective method for studying the binding interactions of protein with ligand at a molecular level. It is usually used to calculate the binding constant and the number of binging sites of the protein-drug system. If the basic amino acid residues or surrounding environment changed, fluorescence of the protein occurred the corresponding changes. When the excitation wavelength at 280 nm is adopted, the naturally fluoresces of Trypsin is mainly attributed to emission of tryptophan and tyrosine residues. Whereas when the excitation wavelength is fixed at 295 nm, only tryptophan residues are excited[8]. Fluorescence quenching experiments were performed according to the experimental step of “Fluorescence measurements”, to explore the fluorescence spectra of Trypsin-Cefpirome system. The fluorescence spectra of Trypsin in the presence of different concentrations of Cefpirome were shown in Figure 2.
As can be seen from Figure 2, the fluorescence intensity of Trypsin was found to decrease regularly with the addition of Cefpirome, which indicated that the interaction of Cefpirome and Trypsin leads to the fluorescence quenching of Trypsin. Under the conditions of fixed temperature, ionic strength, and pH, fluorescence quenching may result from ground-state complex formation or dynamic quenching with energy transfer. Thus the fluorescence quenching mechanism is usually divided into static quenching and dynamic quenching[10]. Dynamic quenching results from collision between fluorophore and quencher, and static quenching is due to the formation of ground-state complex between fluorophore and quencher[11]. In order to confirm the quenching mechanism of the Trypsin-Cefpirome system, the experiment data were analyzed by Stern-Volmer[12] Eq. (2):
F0 / F = 1 + Kq τ0[L] = Ksv[L] (2)
Where, F0 and F denote the fluorescence intensities in the absence and presence of quencher, respectively. Ksv is Stern-Volmer quenching constant; [L] is the concentration of the quencher; Kq is the bimolecular quenching rate constant; τ0 is the average lifetime of the molecule without the quencher which is about 10-8 s. According to Eq. (2), based on the linear fit plot of F0/F versus [L], the Ksv values can be obtained. The results were shown in Table 1. The differing dependence on temperature is a way to distinguish static quenching from dynamic quenching. Dynamic quenching depends upon diffusion: higher temperatures result in larger diffusion coefficients. As a result, the values of Ksv increase with increasing temperature. In contrast, higher temperatures are likely to result in decreasing the stability of complexes, and lower values of the static quenching constants[13]. From Table 1, it can be seen that all of the above Kq values were greater than the maximum value (2.0 × 10¹⁰ M-1•s-1) of the diffusion controlled quenching process of biological macromolecules. It provides the preliminary evidences that the dominating quenching mechanism is not dynamic but static[14]. In addition, the values of Ksv decreased with the rising temperature, this also suggested that a static quenching process may exist due to the formation of Trypsin-Cefpirome complex.
For the static quenching interaction, the binding constants (Ka) and the number of binding sites (n) per molecule can be calculated by the double logarithm equation[15]:
Log(F0/F - 1) = nlogKa + nlog{[L] - n(1- F/F0)[Bt]} (3)
Where F0 and F are respectively the fluorescence intensities before and after the increase in quencher, [L] is the total drug concentration, and [Bt] is the total protein concentration. The curve of log(F0/F − 1) versus log{[L] − n(1 − F/F0)[Bt]} is drawn and linearly fitted, then the value of n can be obtained from the slope of the plot, the value of Ka can be obtained from the value of n and the intercept of the plot. The results were listed in Table 2. The decreasing trend of binding constants (Ka) with increasing temperature was in accordance with Ksv’s dependence on temperature, as mentioned above[16]. As shown in Table 2, the Ka between Cefpirome and Trypsin decreased with increasing temperature, further suggesting that the quenching was a static process. The values of n were about 1, indicating the existence of a single binding site of Cefpirome on Trypsin[17]. The values of Ka and n decreased with increasing temperature, which showed that the complex of Trypsin-Cefpirome is unstable, and part of the complex decomposed. While, the binding constants when λex = 280 nm were greater than the binding constants when λex = 295 nm at the same temperature. This indicated that tyrosine residues and tryptophan residues were both involved in the interaction of Trypsin and Cefpirome.
Figure 2: Fluorescence spectrum of Trypsin-Cefpirome system (T = 310 K, λex = 280 nm).
CTrypsin = 4.0 × 10⁻⁶ M, CCefpirome = (0, 0.08, 0.4, 0.6, 1.0, 2.0, 4.0, 5.0, 7.0, 8.0) × 10-5 M
Table 1: Quenching constant of Trypsin and Cefpirome at different temperatures.
| Λex (nm) | T (K) | Kq (M-1 s-1) | Ksv (M-1) | R1 | SD |
|---|---|---|---|---|---|
| 280 | 303 | 3.03 × 10¹² | 3.03 × 10⁴ | 0.9975 | 0.0337 |
| 310 | 2.75 × 10¹² | 2.75 × 10⁴ | 0.9981 | 0.0264 | |
| 318 | 2.31 × 10¹² | 2.31 × 10⁴ | 0.9932 | 0.0365 | |
| 295 | 303 | 2.40 × 10¹² | 2.40 × 10⁴ | 0.9912 | 0.0998 |
| 310 | 1.75 × 10¹² | 1.75 × 10⁴ | 0.9960 | 0.0259 | |
| 318 | 1.68 × 10¹² | 1.68 × 10⁴ | 0.9944 | 0.0469 |
R1 is the linear relative coefficient of F0/F ~ [L]. SD is the standard deviation of Ksv.
Table 2: Binding constant of Trypsin and Cefpirome at different temperatures.
| Δex (nm) | T (K) | Ka (M-1) | n | R2 | SD |
|---|---|---|---|---|---|
| 280 | 303 | 3.14 × 10⁴ | 0.82 | 0.9956 | 0.0326 |
| 310 | 2.92 × 10⁴ | 0.83 | 0.9954 | 0.0279 | |
| 318 | 2.40 × 10⁴ | 0.70 | 0.9910 | 0.0264 | |
| 295 | 303 | 1.95 × 10⁴ | 0.96 | 0.9911 | 0.0902 |
| 310 | 1.74 × 10⁴ | 0.94 | 0.9957 | 0.0306 | |
| 318 | 1.49 × 10⁴ | 0.99 | 0.9971 | 0.0282 |
R2 is the linear relative coefficient of log[(F0 − F)/F] ~ log [L]. SD is the standard deviation of Ka.
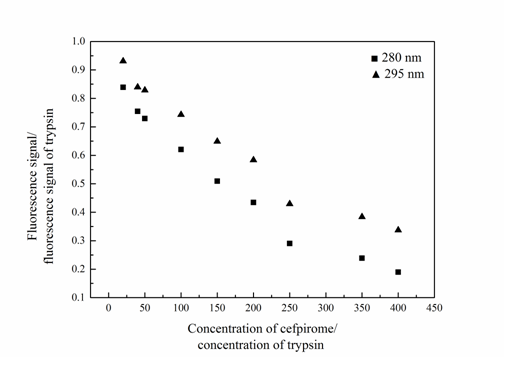
Participation of amino acid residue studies in the Trypsin-Cefpirome system By comparing the fluorescence quenching of Trypsin excited at 280 and 295 nm, the participation of tyrosine and tryptophan groups in Trypsin-Cefpirome system can be assessed[18]. Figure 3 was the quenching curve of Trypsin-Cefpirome system. As seen in Figure 3 the fluorescence quenching of Trypsin excited at 280 nm by Cefpirome was more extended than that excited at 295 nm. The quenching curves representing 280 and 295 nm excitation wavelength did not overlap. This indicated that the tyrosine and tryptophan residues were both involved in the reaction.
Figure 3: Quenching curves of Trypsin-Cefpirome system (λex = 280/295 nm)
CTrypsin = 4.0 × 10⁻⁶ M, CCefpirome = (0.4, 0.8, 1.0, 2.0, 3.0, 4.0, 5.0, 7.0, 8.0) × 10-5 M
UV-Vis absorption studies of Trypsin-Cefpirome system
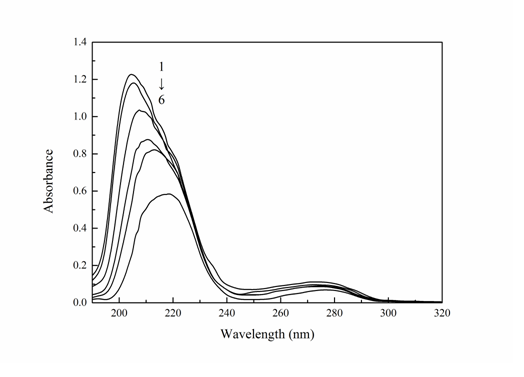
UV-Vis absorption spectral measurement is extremely easier and a successful method in investigating the structural alterations and perceiving the protein-drug complex formation[19]. For static quenching, the absorption spectra of fluorescence substance change because of the formation of ground-state complex. In contrast, the dynamic quenching only affects the excited states of the fluorophore and thus no changes in the absorption spectra are expected[20]. The UV-Vis absorption spectra of Trypsin in the absence and presence of Cefpirome were shown in Figure 4. It can be seen Trypsin had two absorption peaks. There are a strong absorption peak at 205 nm and a weak peak at 278 nm. With the gradual addition of Cefpirome to the Trypsin solution, the intensity of the peak at 205 nm decreased and an obvious red shift in the position of the absorbance peak could be observed. It can be judged that the UV-Vis absorption spectrum changed, and the Trypsin-Cefpirome system had generated a new ground-state complex, the process was static quenching.
Figure 4: Absorption spectra of Cefpirome-Trypsin system (T = 298 K)
CTrypsin = 4.0 × 10⁻⁶ M, CCefpirome = (0, 0.4, 0.8, 2.0, 4.0, 5.0) × 10-5 M
Synchronous fluorescence spectra studies of Trypsin-Cefpirome system
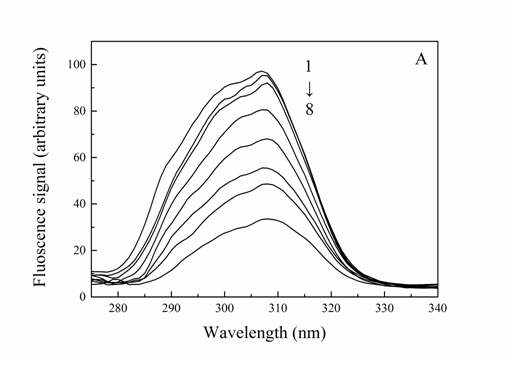
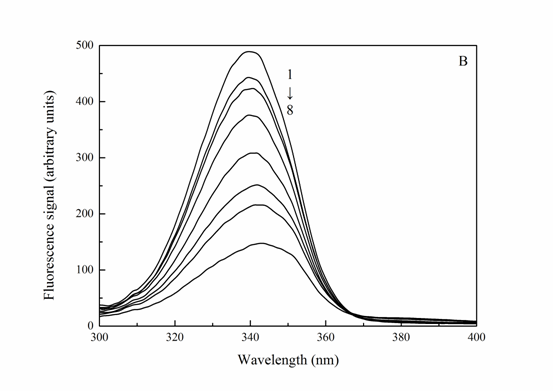
Synchronous fluorescence involves simultaneous scanning of the excitation and emission monochromators while maintaining a constant wavelength interval (Δλ) between both. The synchronous fluorescence spectroscopy can offer the characteristic information of the tyrosine residues and tryptophan residues when the scanning interval Δλ (Δλ = λem – λex) is set at 15 and 60 nm, respectively, which has been used to study the microenvironment of amino acid residues by the determination of the shift of emission maxima[21]. As a sensitive technique, synchronous fluorescence has various advantages such as its spectral bandwidth reduction, spectral simplification and avoiding different perturbing effect[22]. The synchronous fluorescence spectroscopy of Trypsin-Cefpirome system was shown in Figure 5. It was obvious that the emission strengths of both tyrosine and tryptophan decreased. It was indicated that the tyrosine and tryptophan residues were involved in the reaction. And a visible red shift at the maximum emission wavelength was observed upon addition of Cefpirome when Δλ was 60 nm, which was consistent with the fact that the conformation of Trypsin was changed, the polarity around the tryptophan residues increased and the hydrophobicity decreased[23].
Figure 5: Synchronous fluorescence spectrum of Trypsin-Cefpirome (T = 310 K) A: Δλ = 15 nm, B: Δλ = 60 nm, CTrypsin = 4.0 × 10⁻⁶ M, CCefpirome = (0, 0.8, 4.0, 8.0, 20, 30, 40, 50) × 10-6 M
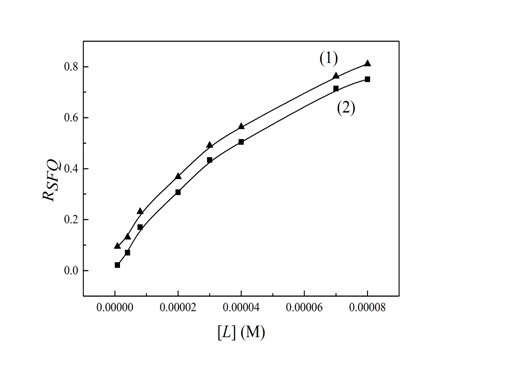
In addition, the synchronous fluorescence spectroscopy can confirm the specific binding site of drug to protein. For comparison, the synchronous fluorescence quenching ratios (RSFQ) that express the decreasing percentages of synchronous fluorescence intensity were calculated by using the equation: RSFQ = 1 − F/F0[24]. The corresponding ratios of synchronous fluorescence quenching (RSFQ) were illustrated in Figure 6. From Figure 6 it can be seen that the RSFQ for Δλ = 60 nm were bigger than corresponding ones for Δλ = 15 nm, which revealed that the binding site of Cefpirome to the Trypsin molecules was closer to tryptophan residues.
Figure 6: Ratios of synchronous fluorescence quenching (RSFQ) of Trypsin -Cefpirome (T = 298 K), (1) Δλ = 60 nm, (2) Δλ = 15 nm, CTrypsin = 4.0 × 10⁻⁶ M, CCefpirome = (0.08, 0.4, 0.6, 2.0, 3.0, 4.0, 7.0, 8.0) × 10-5 M
Type of interaction force in Trypsin-Cefpirome system
The forces acting between drug and bimolecular include hydrogen bond, van der Waals force, electrostatic force and hydrophobic interaction force. The thermodynamic parameters, enthalpy change ΔH, entropy change ΔS and free energy change ΔG, are the main evidences to determine the binding mode[25]. Ross and Subramanian reported that when ΔH < 0 and ΔS > 0, the electrostatic force dominates the interaction; when ΔH < 0 and ΔS < 0, van der Waals interactions and hydrogen bonds dominate the reaction and when ΔH > 0 and ΔS > 0, hydrophobic interactions dominate the binding process[26]. The thermodynamic parameters can be calculated on the basis of Van’t Hoff equation[27]:
InKa = - ΔH/ RT + ΔS/ R (4)
ΔG = ΔH - TΔS (5)
R is the gas constant (R = 8.314 J•mol-1•K-1). T is the absolute temperature. When the temperature varies over a small range, ΔH can be considered to be constant. ΔH was obtained from the slope of the linear plot (Eq. (4)) based on RlnKa versus 1/T. Then the values of ΔS and ΔG were calculated by Eq. (5). All the thermodynamic parameters were listed in Table 3. Table 3 showed that the negative sign for ΔG indicated the spontaneity of the binding for Cefpirome with Trypsin. The negative values of ΔH and positive values of ΔS indicate that electrostatic interactions play a major role in the interaction between Cefpirome and Trypsin.
Table 3: The thermodynamic parameter of Trypsin-Cefpirome at different temperatures.
| T (K) | Ka (M-1) | ΔH (KJmol-1) | ΔS (J mol-1 K-1) | ΔG (KJ mol-1) | |
|---|---|---|---|---|---|
| λex = 280 nm | 303 | 3.14 × 10⁴ | -6.27 | 65.38 | -26.08 |
| 310 | 2.92 × 10⁴ | -6.27 | 65.26 | -26.50 | |
| 318 | 2.40 × 10⁴ | -6.27 | 64.15 | -26.67 | |
| λex = 295 nm | 303 | 1.95 × 10⁴ | -14.39 | 34.62 | -24.88 |
| 310 | 1.74 × 10⁴ | -14.39 | 34.77 | -25.17 | |
| 318 | 1.49 × 10⁴ | -14.39 | 34.65 | -25.41 |
Energy transfer of Trypsin-Cefpirome system
The importance of the energy transfer in biochemistry is that the efficiency of transfer can be used to evaluate the distance between the ligand and the tryptophan residues in the protein. According to the theory of Förster’s non-radiative energy transfer[28], the energy transfer will take place under these conditions: (1) the donor can produce fluorescence, (2) fluorescence emission spectrum of the donor and UV-V is absorbance spectrum of the acceptor have more overlap and (3) the distance between the donor and the acceptor is approached and lower than 8 nm. The efficiency of energy transfer, E, is depended on not only the distance (r) between the donor-acceptor pair, but also the critical energy transfer distance, R0, with the following relation[29]:
E = R60 / [R60 + r6] = 1 - F/F0 (6)
Where, r is the binding distance between the protein and ligand. R0 is the Forster distance, which is the distance at the efficiency of the energy transfer is 50%. R0 can be calculated according to the equation below:
R60 = 8.78 x 10⁻²⁵K2ΦN-4J (7)
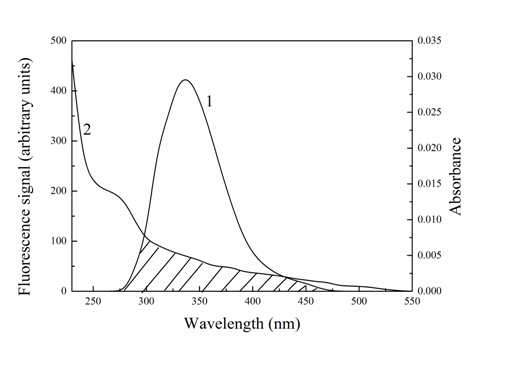
K² is the orientation factor in resonance energy transfer and assumed to be equal to 2/3. N is the refractive index of medium, and the average value of water and the solution being 1.336 is used. Φ is the fluorescence quantum yield of the donor in the absence of the acceptor, where a value of 0.118 is used[30]. J is the overlap integral between the fluorescence emission spectrum of the donor and absorption spectrum of the acceptor (showed in Figure 7). J can be calculated according to the equation below:
J = (∑F(λ)ε(λ)λ4Δλ) / ∑(Fλ)Δλ (8)
F(λ) is the total fluorescence intensity of the normalized fluorescence emission spectrum to unity. ε(λ) is the molar extinction coefficient of the acceptor (Cefpirome) at λ. λ is the wavelength in cm. The values of E, J, R0 and r were listed in Table 4. As can be seen from Table 4, the distance between Trypsin and Cefpirome was less than 8 nm, which indicated that the energy transfer from Trypsin to Cefpirome was non-radiative energy transfer.
Figure 7: Overlap of the fluorescence spectrum of Trypsin (λex = 280 nm) (1) with the absorption spectrum of Cefpirome (2) (T = 298 K) CCefpirome = CTrypsin = 4.0 × 10⁻⁶ M
Table 4: Parameters of E, J, R0, r between Trypsin and Cefpirome at different temperatures.
| T (K) | E (%) | J (cm³ L mol-1) | R0 (nm) | r (nm) |
|---|---|---|---|---|
| 303 | 16.11 | 1.50 × 10⁻¹⁵ | 1.79 | 2.35 |
| 310 | 16.91 | 1.50 × 10⁻¹⁵ | 1.79 | 2.33 |
| 318 | 19.18 | 1.52 × 10⁻¹⁵ | 1.79 | 2.28 |
Molecular docking
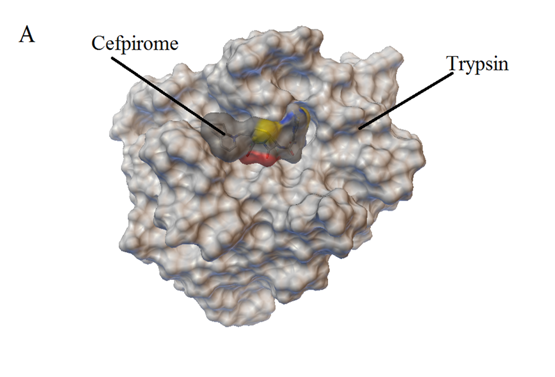
Molecular simulation technology was widely used in the analysis of the interaction between protein and ligand[31]. The aim of molecular docking was found to be the best binding position between the substrate and the receptor molecule[32]. The optimal binding position of trypsin and drug small molecule was selected by molecular docking software, the docking results data processing shows that, the combination of Cefpirome and Trypsin for 26.26 KJ/mol, and the results with the experiment of the proceeds of the thermodynamic parameters are very close to (ΔG = 26.08 KJ/mol), which is further evidence of the interaction between Cefpirome and Trypsin.
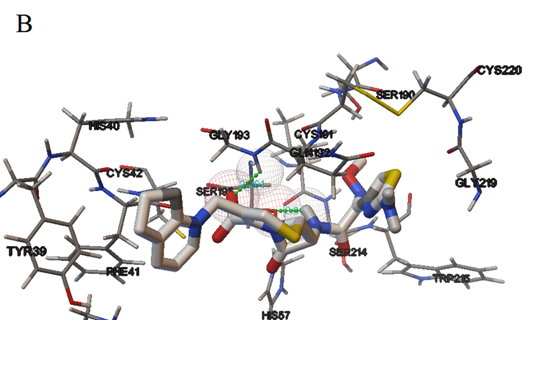
As shown in Figure 8, it is the best conformation of Cefpirome with Trypsin molecular docking. Cefpirome molecules are ammonia acid residues Tyr39, Cys191, Phe41, Cys42, His40, Ser195, Gly193, His57, Gln192, Ser214, Trp215, Ser190, Gly219 and Cys220 by surrounded, most amino acid residues of hydrophobic amino acid residues[33,34]. This result indicates that the hydrophobic interaction exists between Cefpirome and Typsin, and the electrostatic attraction is the main force. And Cefpirome can effectively quench the Trypsin fluorescence, which is consistent with the experimental results of fluorescence spectra. Figure 8 is the best conformation of Cefpirome and Trypsin molecular docking.
Figure 8: Computation docking model of the interaction between Cefpirome and Trypsin (A) Binding site in the Trypsin cavity, (B) Detailed illustration of the amino acid residues lining the binding site in the Trypsin cavity.
More clearly from the Figure 8 found that Cefpirome with Ser195 and Gly193 form hydrogen bond, bond length were 2.013, 2.201 Å. The results show that there are strong hydrogen bonding effect between Cefpirome and Trypsin. Therefore, the research results show that the combination of molecular docking model of Cefpirome and Trypsin is mainly the hydrophobic interaction; hydrogen bonding interactions exist at the same time, consistent with the experimental results.
Hill’s coefficient of the Trypsin-Cefpirome system
In biochemistry, the binding of a ligand molecule and a macromolecule at one site often influences the affinity for other ligand molecules with this macromolecule. This is known as cooperative binding. It is classified into positive cooperativity, negative cooperativity and non-cooperativity according to the promotion or inhibition of the affinity for other ligand molecules. Usually, Hill’s coefficient was used to determine the cooperativity of the drug and protein[35], which can be calculated graphically on the basis of the following equation:
lg Y / 1 - Y = lgK + nHlg[L] (9)
Where Y is the fractional binding saturation, K is the binding constant and nH is the Hill’s coefficient. Values of Hill’s coefficient > 1 indicate positive cooperativity, values < 1 indicate negative cooperativity and values = 1 indicate a non-cooperative reaction. In the fluorescence experiments:
Y / (1 - Y) = Q / Qm - Q (10)
Q = F0 - F /F0 (11)
1/Qm is the intercept of a plot of 1/Q vs. 1/[L]. Hill’s coefficients of Trypsin-Cefpirome system were presented in Table 5. The values of nH were < 1 in the systems at different temperatures, which indicated that there is negative cooperation in the interaction of Cefpirome with Trypsin.
Table 5: Hill coefficient of Trypsin-Cefpirome systems at different temperatures.
| T (K) | λex = 280 nm | λex = 295 nm | ||
|---|---|---|---|---|
| nH | R3 | nH | R3 | |
| 303 | 0.54 | 0.9990 | 0.74 | 0.9934 |
| 310 | 0.52 | 0.9987 | 0.70 | 0.9985 |
| 318 | 0.63 | 0.9944 | 0.68 | 0.9966 |
R3 is the linear relative coefficient of lg[Y / (1 − Y)] ~ lg [L].
Conclusion
In this experiment, the reaction mechanism of Trypsin- Cefpirome system was studied by multi-spectroscopy methods and molecular modeling. The results revealed that Cefpirome could bind directly into the Trypsin and the microenvironment of Trypsin was changed in this process. And the quenching of Trypsin fluorescence by Cefpirome was a static process. Fluorescence experiment and study of computational molecular modeling indicated that the main interaction is electrostatic interactions and there were also hydrogen bonds and hydrophobic force between Cefpirome and Trypsin. In addition, there was negative cooperativity in the interaction of Trypsin with subsequent ligand as the previous ligand (Cefpirome) binding to Trypsin gradually. This study should be helpful to understand the transport mechanism of cephalosporin drugs under in vivo conditions, and to understand pharmaceutical research on the interaction of drugs and Trypsin being carrier. In addition, the established research route to investigate the specific binding sties of Cefpirome on Trypsin can also be applied to explore other drug-protein.
References
- 1. Li, Y., Wang, F.A., Ren, B.Z. Measurement and Correlation of Solubilities of Cefpirome Sulfate in Aqueous Alcohol Solution between (278.15 and 308.15) K. (2010) J Chem Eng Data 55: 5375-5381.
Pubmed || Crossref || Others - 2. Sugihara, H., Narita, N., Takatsu, R., et al. Study of the pharmacokinetics of cefpirome sulphate in the elderly. (1998) J Clin Pharm Ther 23(5): 375-379.
Pubmed || Crossref || Others - 3. Song, H., Chen, C.Y., Zhao, S.G., et al. Interaction of gallic acid with trypsin analyzed by spectroscopy. (2015) J Food Drug Anal 23(2): 234-242.
Pubmed || Crossref || Others - 4. Wang, Y., Luo, W., Reiser, G. Trypsin and trypsin-like proteases in the brain: Proteolysis and cellular functions. (2008) Cell Mol Life Sci 65: 237-252.
Pubmed || Crossref || Others - 5. Kaur, G., Tripathi, S.K. Investigation of trypsin-CdSe quantum dot interactions via spectroscopic methods and effects on enzymatic activity. (2015) Spectrochim Acta A Mol Biomol Spectrosc 134: 173-183.
Pubmed || Crossref || Others - 6. Patil, C.D., Borase, H.P., Suryawanshi, R.K., et al. Trypsin inactivation by latex fabricated gold nanoparticles: A new strategy towards insect control. (2016) Enzyme Microb Technol 92: 18-25.
Pubmed || Crossref || Others - 7. 6. Xu, H.L., Yao, N.N., Li, G.Y., et al. Spectroscopic Studies on the Interaction Between Aucubin and Bovine Serum Albumin Without or With Copper II or Iron III. (2014) Spectroscop Lett 47: 119-130.
Pubmed || Crossref || Others - 8. Enyedy, É.A., Horváth, L., Hetényi, A., et al. Interactions of the carrier ligands of antidiabetic metal complexes with human serum albumin: A combined spectroscopic and separation approach with molecular modeling studies. (2011) Bioorg Med Chem Let 19(14): 4202-4210.
Pubmed || Crossref || Others - 9. Sharma, D., Lata, M., Singh, R., et al. Cytosolic proteome profiling of aminoglycosides resistant mycobacterium tuberculosis clinical isolates using MALDI-TOF/MS. (2016) Front Microbiol 7: 1816.
Pubmed || Crossref || Others - 10. Guo, X.J., Han, X.W., Tong, J., et al. The investigation of the interaction between piracetam and bovine serum albumin by spectroscopic methods. (2010) J Mol Struct 966(1-3): 129-135.
Pubmed || Crossref || Others - 11. Mahaki, H., Memarpoor-Yazdi, M., Chamani, J., et al. Interaction between ropinirole hydrochloride and aspirin with human serum albumin as binary and ternary systems by multi-spectroscopic, molecular modeling and zeta potential. (2013) J Lumin 134: 758-771.
Pubmed || Crossref || Others - 12. Li, H.L., Zhang, L.Y., Zhuang, S.L., et al. Fluorescence Investigation on the Interaction of a Prevalent Competitive Fluorescent Probe with Entomic Odorant Binding Protein. (2013) Spectroscop Let 46: 527-534.
Pubmed || Crossref || Others - 13. Yu, X.Y., Liu, R.H., Yang, F.X., et al. Study on the interaction between dihydromyricetin and bovine serum albumin by spectroscopic techniques. (2011) J Mol Struct 985: 407-412.
Pubmed || Crossref || Others - 14. Gao, J., Guo, Y., Wang, J., et al. Spectroscopic analyses on interaction of o-Vanillin-d-Phenylalanine, o-Vanillin-l-Tyrosine and o-Vanillin-l-Levodopa Schiff Bases with bovine serum albumin (BSA). (2011) Spectrochim Acta A Mol Biomol Spectrosc 78: 1278-1286.
Pubmed || Crossref || Others - 15. Liu, B.M., Zhang, J., Hao, A.J., et al. The increased binding affinity of curcumin with human serum albumin in the presence of rutin and baicalin: A potential for drug delivery system. (2016) Spectrochim Acta A Mol Biomol Spectrosc 155: 88-94.
Pubmed || Crossref || Others - 16. Xing, A., Jia, B., Li, X., et al. In vitro study on the interaction of methoxyflurane with human serum albumin: Phenotypic characterization. (2013) J Fluorine Chem 153: 107-113.
Pubmed || Crossref || Others - 17. Wang, Q., Huang, C.R., Jiang, M., et al. Binding interaction of atorvastatin with bovine serum albumin: Spectroscopic methods and molecular docking. (2016) Spectrochim Acta A Mol Biomol Spectrosc 156: 155-163.
Pubmed || Crossref || Others - 18. Zeng, H.J., Wang, Y.P., Yang, R., et al. Inhibitory effects of daidzein and genistein on trypsin: Insights from spectroscopic and molecular docking studies. (2016) Int J Biol Macromol 89: 336-343.
Pubmed || Crossref || Others - 19. Sudha, A., Srinivasan, P., Thamilarasan, V., et al. Exploring the binding mechanism of 5-hydroxy-3′,4′,7-trimethoxyflavone with bovine serum albumin: Spectroscopic and computational approach. (2016) Spectrochim Acta A Mol Biomol Spectrosc 157: 170-181.
Pubmed || Crossref || Others - 20. Wang, R.Y., Wang, X.G., Li, Z.G., et al. Study on the interaction between bovine serum albumin and 40-azido-20-deoxyfluoroarabinocytidine or analogs by spectroscopy and molecular modeling. (2014) Spectrochim Acta A Mol Biomol Spectrosc 132: 786-794.
Pubmed || Crossref || Others - 21. Hemmateenejad, B., Shamsipur, M., Samari, F., et al. Combined fluorescence spectroscopy and molecular modeling studies on the interaction between harmalol and human serum albumin. (2012) J Pharm Biomed Anal 67-68: 201-208.
Pubmed || Crossref || Others - 22. Kumari, M., Maurya, J.K., Singh, U.K., et al. Spectroscopic and docking studies on the interaction between pyrrolidinium based ionic liquid and bovine serum albumin. (2014) Spectrochim Acta A Mol Biomol Spectrosc 124: 349-356.
Pubmed || Crossref || Others - 23. Zhang, J., Chen, L., Zeng, B., et al. Study on the binding of chloroamphenicol with bovine serum albumin by fluorescence and UV-vis spectroscopy. (2013) Spectrochim Acta A Mol Biomol Spectrosc 105: 74-79.
Pubmed || Crossref || Others - 24. Chen, D., Wu, Q., Wang, J., et al. Spectroscopic analyses and studies on respective interaction of cyanuric acid and uric acid with bovine serum albumin and melamine. (2015) Spectrochim Acta A Mol Biomol Spectrosc 135: 511-520.
Pubmed || Crossref || Others - 25. Meti, M.D., Nandibewoor, S.T., Joshi, S.D., et al. Multi-spectroscopic investigation of the binding interaction of fosfomycin with bovine serum albumin. (2015) J Pharm Anal 5: 249-255.
Pubmed || Crossref || Others - 26. Huang, L., Li, L.Z., Li, H.L., et al. Interaction Between Neuroglobin and Caffeine by Multispectroscopic Methods. (2013) Spectroscop Lett 46(6): 433-440.
Pubmed || Crossref || Others - 27. Tan, X.J., Song Z.H., Wang, Z.L. Characterization of the interaction between bovine serum albumin and doxycycline by chemiluminescence and molecular docking. (2016) Instrum Sci Technol 44(3): 294-307.
Pubmed || Crossref || Others - 28. Guo, X.J., Li, X.Z., Jiang, Y.C., et al. A spectroscopic study on the interaction between p-nitrophenol and bovine serum albumin. (2014) J Lumin 149: 353-360.
Pubmed || Crossref || Others - 29. Zhang, X.H., Lin, Y.J., Liu, L.N., et al. Study on the synthesis of sulfonamide derivatives and their interaction with bovine serum albumin. (2015) Luminescence 30(3): 269-279.
Pubmed || Crossref || Others - 30. Moghaddam, M.M., Pirouzi, M., Saberi, M.R., et al. Comparison of the binding behavior of FCCP with HSA and HTF as determined by spectroscopic and molecular modeling techniques. (2014) Luminescence 29(4): 314-331.
Pubmed || Crossref || Others - 31. Shu, Y., Xue, W.W., Xu, X.Y., et al. Interaction of erucic acid with bovine serum albumin using a multi-spectroscopic method and molecular docking technique. (2015) Food Chem 173: 31-37.
Pubmed || Crossref || Others - 32. Sharma, D., Lata, M., Faheem, M., et al. M.tuberculosis ferritin (Rv3841): Potential involvement in Amikacin (AK) & Kanamycin (KM) resistance. (2016) Biochem Biophy Resear Communi 478(2): 908-912. Kanamycin (KM) resistance.
Pubmed || Crossref || Others - 33. Sharma, D., Bish, D. An efficient and rapid method for enrichment of lipophilic proteins from Mycobacterium tuberculosis H37Rv for two-dimensional gel electrophoresis. (2016) Electrophoresis. 37(9): 1187-1190.
Pubmed || Crossref || Others - 34. Sharma, D., Bisht, D. Secretory proteome analysis of streptomycin resistant Mycobacterium tuberculosis clinical isolates. (2017) SLAS Discov.
Pubmed || Crossref || Others - 35. Han, R., Liu, B., Li, G., et al. Investigation on the interaction of cefpirome sulfate with lysozyme by fluorescence quenching spectroscopy and synchronous fluorescence spectroscopy. (2016) Luminescence 31(2): 580-586.
Pubmed || Crossref || Others


