Statistical Optimization of Xanthan Gum Production and its Characterization Using Pseudomonas aeruginosa NCIM (2948) in Submerged Fermentation (SMF) Process
Suheela Bhat1, Abhishak Dutt Tripathi2*, Khan Nadiya Jan1, Kamlesh Kumar Maurya2*
Affiliation
- 1Faculty of Engineering and Interdisciplinary Sciences, Jamia Hamdard New Delhi-110062, India
- 2Centre of Food Science and Technology, Banaras Hindu University, Varanasi 221005, India
Corresponding Author
Abhishak Dutt Tripathi, Centre of Food Science and Technology, Banaras Hindu University, Varanasi 221005, India, Tel: 91-9450533651; E-mail: abhi_itbhu80@rediffmail.com
Citation
Abhishak Dutt Tripathi. Statistical Optimization of Xanthan Gum Production and its Characterization Using Pseudomonas aeruginosa NCIM (2948) in Submerged Fermentation (SMF) Process. (2018) J Nanotechnol Material Sci 5(1): 8- 13.
Copy rights
© 2018 Abhishak Dutt Tripathi. This is an Open access article distributed under the terms of Creative Commons Attribution 4.0 International License.
Keywords
Pseudomonas aeruginos; Process variables; Optimization; Xanthan production; Characterization
Abstract
In the present study Pseudomonas aeruginosa NCIM 2948 was used to produce exo polysaccharide xanthan using Xanthomona scampestris NCIM 5028 as control strain and efforts have been made to optimize the variables viz carbon source, nitrogen source, carbon concentration, nitrogen concentration and agitation speed for enhanced xanthan gum production. Optimization of process variables was done by central composite rotatable design (CCRD) using design expert (DX 8.0.7) software. Shake flask cultivation performed under optimum condition viz; 55 g/L carbon concentration, 5 g/L nitrogen concentration and 200 rpm agitation speed gave xanthan yield of 17 g/L using sucrose as carbon source and soya bean casein hydrolysates as nitrogen source. Batch cultivation further performed in 7.5 L lab scale bioreactor (working volume: 3L) under optimized condition gave maximum cell biomass of 13 ± 0.5 g/L with a xanthan content of 17 g/L after 72h of fermentation. Scale up study on bioreactor gave maximum xanthan yield. Xanthan yield (Yp/x) in terms of cell biomass produced was found to be 1.33 (g/g). Maximum productivity was found to be 0.24 g/Lhr which is higher than previous reports under similar condition. Characterization of xanthan gum was done by FTIR.
Introduction
Xanthan gum is an extracellular hetro-polysaccharide, which is produced by the aerobic fermentation of Xanthomonascompestris. It was first discovered in the 1950’s at the Northern Regional Research Laboratories (NRRL) of the United State Department of Agriculture[1]. Xanthan is composed of pentasaccharide repeating units containing D-glucose, D-mannose, D-glucoronic acid (at a ratio of 2:2:1), acetal-linked pyruvic acid and D-acetal groups[2]. Because of its unique structure, xanthan displays special pseudo plastic properties, high viscosity and solubility, enhanced stability over a wide range of pH values and temperatures, as well as compatibility with many salts, food ingredients and other polysaccharides used as thickening agents. These characteristics of xanthan contribute range wide of application especially in the food industry as a thickening and stabilizing agent, in the cosmetics, in the paper milling, textiles and the pharmaceuticals sector and also in enhanced oil recovery. The production, recovery and properties of xanthan gum have been reviewed recently[3].
The toxicological and safety properties of xanthan gum for food and pharmaceuticals application have been extensively researched. Xanthan is a non-toxic and does not inhibit growth. It is non-sensitizing and does not cause skin or eye irritation. On this basis, xanthan has been approved by the United States and Food Drug Administration (FDA) for use as a food additive without any specific quantity limitations[4]. In 1980, the European Economic Community list xanthan as an item of food emulsifier/stabilizer, E-415. Most of the studies revealed that xanthan is a function of various nutritional and cultural conditions.Process optimizations for xanthan yield in various microorganisms has been done by taking into account various media components like pH, stirrer speed and temperature[5]. The concentration of carbon source, nitrogen source and temperature were optimized using response surface methodology for enhanced xanthan gum production[6].
Various factors like carbon source, nitrogen source, agitation speed, sodium-potassium salts, and type of bacterial strain greatly influence the production of xanthan gum[7]. The present research work was carried out to use Pseudomonasaeruginosa NCIM 2948 as exo polysaccharide producing strain using Xanthomonascampestris NCIM 5028 as control strain and to optimize process variables like carbon source, carbon concentration, nitrogen source, nitrogen concentration and agitation speed.Shake flask cultivation was further scale up in 7.5 L bioreactor in order to study the growth kinetics in batch mode under optimized conditions.
Materials and Methods
Microorganism
Pseudomonas aeruginosa NCIM 2948 was used for fermentative xanthan gum production. The culture was maintained on nutrient agar slants at 4oC and was sub cultured after every 20 days.
Shake flask cultivation condition
Submerged fermentation experiments were carried out in cotton plugged 250 mL Erlenmeyer flasks containing 100 mL of production medium (g/L): sucrose (40); citric acid (2.1), Soyabean casein hydrolysates (1.144), KH2PO4 (2.86); MgCl2 (0.507); Na2SO4(0.089); CaCO3 (0.026), H3BO3(0.006), ZnO (0.006), FeCl3 (0.020),)]. Media was sterilized at 121°C prior to inoculation. The pH of resulting broth was adjusted to 7.0 with 0.1 NNaOH/0.1 NHCl solutions.
The organism was cultivated in a 250 mL Erlenmeyer flask containing 50 mL of growth media at an agitation speed of 150 rpm at 35°C for 24 h. For production of xanthan, 100 mL of production media was taken in a 500 mL flask and was inoculated with 5 mL of inoculum. Different experimental trials were performed by keeping the flasks under shaking condition for 72 h at varying agitation speed and with different carbon and nitrogen concentration in incubator plus shaker (Sigma, USA).
Effect of different carbon source on growth and Xanthan gum production
The production of xanthan was carried out using different carbon sources like fructose, sucrose, glucose, and glycerol. Inoculum was prepared as discussed previously. After preparation of media inoculum was inoculated in 100 ml of production media. Each flask contained xanthan production media and a different carbon source. The flasks were incubated at 35°C and 150 rpm. Biomass and xanthan gum were estimated in culture broth for 72h as shown in table no 1.
Table 1: CCRD of independent variables for optimization of physical factors.
| Run | Type | Factor 1 Carbon concentration(g/L) |
Factor 2 Nitrogen concentration(g/L) |
Factor 3 Agitation speed (rpm) |
|---|---|---|---|---|
| 01 | Center | 0.000 | 0.000 | 0.000 |
| 02 | Factorial | 1.000 | 1.000 | 1.000 |
| 03 | Center | 0.000 | 0.000 | 0.000 |
| 04 | Factorial | 0.000 | 1.682 | 0.000 |
| 05 | Center | 0.000 | 0.000 | 0.000 |
| 06 | Axial | -1.682 | 0.000 | 0.000 |
| 07 | Axial | 0.000 | 0.000 | -1.682 |
| 08 | Center | 0.000 | 0.000 | 0.000 |
| 09 | Axial | 0.000 | -1.318 | 0.000 |
| 10 | Factorial | -1.000 | 1.000 | 1.000 |
| 11 | Center | 0.000 | 0.000 | 0.000 |
| 12 | Factorial | -1.000 | 1.000 | 1.000 |
| 13 | Axial | 0.000 | 0.000 | 1.682 |
| 14 | Center | 14 0.000 | 0.000 | 0.000 |
| 15 | Factorial | 1.000 | -1.000 | 1.000 |
| 16 | Axial | 1.682 | 0.000 | 0.000 |
| 17 | Factorial | 1.000 | -1.000 | 1.000 |
| 18 | Factorial | 1.000 | 1.000 | 1.000 |
| 19 | Factorial | -1.000 | 1.000 | -1.000 |
| 20 | Factorial | 1.000 | 1.000 | -1.000 |
Effect of different nitrogen source on growth and xanthan gum production
Different nitrogen sources like ammonium sulfate, ammonium Nitrate, ammonium chloride, soybean casein hydrolysates were tested for xanthan gum production. Sucrose 40 g/L was used as a carbon source. Cell culture was inoculated at 35°C with agitation speed of 150 rpm .Biomass and xanthan gum were estimated in cell broth for 72 hr as shown in table 2
Table 2: Responses obtained by varying parameters involved in xanthan production.
| Std | Run | Factor 1 Carbon Concentration (g/L) |
Factor 2 Nitrogen concentration (g/L) |
Factor 3 Agitation speed (rpm) |
Biomass (g/L) |
Xanthan (g/L) |
|---|---|---|---|---|---|---|
| Source | Sum of squares | Df | Mean square | F- Value | Prob > F | |
| 6 | 1 | 80 | 1 | 200 | 13 | 7.67 |
| 15 | 2 | 55 | 6 | 150 | 6 | 8 |
| 8 | 3 | 55 | 5 | 200 | 13.68 | 17 |
| 11 | 4 | 55 | 0.36 | 150 | 4 | 6.6 |
| 10 | 5 | 97.04 | 3 | 150 | 17.6 | 6.98 |
| 14 | 6 | 55 | 3 | 234 | 7 | 11.67 |
| 18 | 7 | 55 | 3 | 150 | 7.6 | 9.0 |
| 17 | 8 | 55 | 3 | 150 | 7.98 | 9.89 |
| 1 | 9 | 30 | 1 | 100 | 5.7 | 8.65 |
| 4 | 10 | 80 | 5 | 100 | 7.8 | 8.42 |
| 2 | 11 | 80 | 1 | 100 | 6.9 | 8 |
| 12 | 12 | 55 | 6.36 | 150 | 7.8 | 8.67 |
| 3 | 13 | 30 | 5 | 100 | 3.6 | 6.7 |
| 20 | 14 | 55 | 3 | 150 | 6.79 | 9.7 |
| 5 | 15 | 30 | 1 | 200 | 5 | 6.98 |
| 16 | 16 | 55 | 3 | 150 | 8 | 8.44 |
| 9 | 17 | 12.96 | 3 | 150 | 4.9 | 5.6 |
| 7 | 18 | 30 | 5 | 200 | 5.6 | 7.98 |
| 19 | 19 | 55 | 3 | 150 | 7.9 | 8.99 |
| 13 | 20 | 55 | 3 | 69.9 | 4.8 | 7.9 |
Analytical methods
Dry cell mass
20 mL culture broth obtained in different trials was centrifuged at 80, 00 rpm for 10 min at 4°C and cell pellet was obtained. Supernatant was kept for further estimation. The cell pellet was then dried in pre weighed Petri dishes at 60°C for 12 hr.
Xanthan extraction
Xanthan was extracted by using non- solvent method.90% methanol was used to precipitate xanthan gum present in supernatant. Process was carried out in refrigerated conditions to facilitate the separation of flocculent. Filtration was done to decant water xanthan was dried in vacuum oven for 6 hours.
Sample preparation for FTIR analysis
Extracted xanthan gum was crushed to finer particles in nujol mull and pressed into KBr disc under reduced pressure. The mixture was then analyse during Perkin Elmer model spectrum version 10.03.05 FTIR spectrometer. An absorbance spectrum was controlled at wave number values between 4000 and 400 cm-1 with spectral resolution 8 cm-1. Different peaks at different wave number were obtained giving the idea of carboxyl, carbonyl and acetyl groups present.
Experimental design
A five-level three factor central composite rotary design (CCRD) obtained by using the software (Design Expert 8.0.7, Stat-Ease Inc., USA) was employed to find out the interactive effect of three process variables viz; carbon concentration, nitrogen concentration and agitation speed on xanthan gum production . Twenty set of experiment were designed by design expert trial at different levels of three parameters
Statistical analysis
The experimental data obtained from the design were analyzed by the response surface regression procedure using the following second-order polynomial equation:
Yi = β0 + ∑βixi + ∑ βiix2i + ∑ βijxiji
Where Yi was the predicted response, xixj were independent variables, β0 was the offset term, βi was the linear coefficient, βii was the quadratic coefficient and βij was the interaction coefficient. Analysis of variance (ANOVA) was used to estimate the statistical parameters. The second order polynomial equation was used to fit the experimental data. The significance of the model equation and model terms were evaluated by F- test. The quality of the fit of the polynomial equation was expressed by the coefficient of determination (R2), adjusted and adequate precision. The fitted polynomial equation was expressed as three dimensional surface plots to visualize the relationship between the responses and the experimental levels of each factor used in the design.
Validation
To optimize the level of each factor for maximum response “Point prediction” was employed. The combination of different optimized parameters which gave, maximum response, i.e. maximum xanthan gum production was tested experimentally to see the validity of model.
Bioreactor study
Seed culture was prepared in a 500 mL Erlenmeyer flask containing 150 mL media. Batch cultivation was carried out at optimum temperature (35°C) in a 7.5 L bioreactor (BioFlo/Celligen 115, New Brunswick, USA) containing 3L of media. The reactor was sterilized in an autoclave at 121°C for 20 min, cooled and then inoculated with 50 mL L-1 inoculum. pH of the culture broth was maintained at optimum pH (7.0) by automatic addition of acid or base by pH–mV controller (Mettler Tolledo, USA). Dissolved oxygen was measured by DO probe (Mettler Tolledo, USA). Dissolved oxygen concentration was maintained at 30 % saturation value by cascading the speed of the agitator and air flow rate.
Results and Discussion
Selection of microbial strain
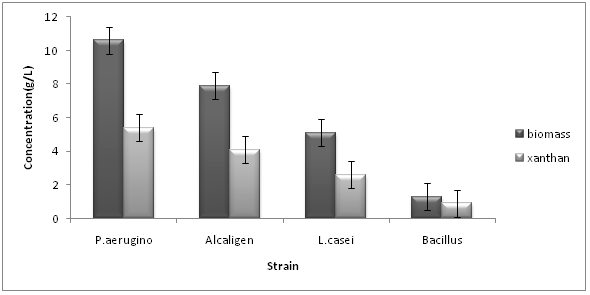
Several microbes were selected for production of xanthan gum. From large number of microbes three microbes Pseudomonas aeruginosa NCIM 2948, Alcaligens sp. NCIM, and Lactobacillus casei NCIM, Bacillus sp were selected so as to check exo polysaccharide gum production. Among these three microbes P.aeruginosa showed best results as shown in Figure 1. Pseudomonas aeroginosa showed highest growth and xanthan production in optimum conditions (35°C, 150 rpm) followed by Alcaligen sp. and then Lactobacillus casei and Bacillus sp. as shown in Figure 1.
Figure 1: Effect of strain on xanthan and biomass (SD ± 0.5).
Effect of different carbon source on biomass and xanthan production.
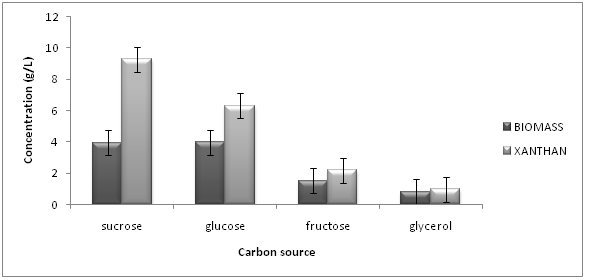
Different carbon sources for the production of xanthan gum using Pseudomonas aeruginosa were chosen. The different carbon sources selected were sucrose, glucose, glycerol, and fructose. They were added at the rate of 4% to the production media, one at a time. Figure 2 shows the biomass (g/L) and xanthan gum (g/L) content in Pseudomonas aeruginosa obtained with different substrates. Biomass of 3.94, g/L and Xanthan gum content of 9.29, g/L were obtained in case of Pseudomonas aeruginosa after 72 hr. Glucose was second best carbon source, fructose third and glycerol was the poorest carbon source among all. Although glucose was found better media for growth of Pseudomonas however production of xanthan was low as shown in Figure 2.
Figure 2: Effect of different carbon source on dry mass and xanthan production in Pseudomonas aeruginosa (SD ± 0.5).
Effect of different nitrogen sources on biomass and xanthan production
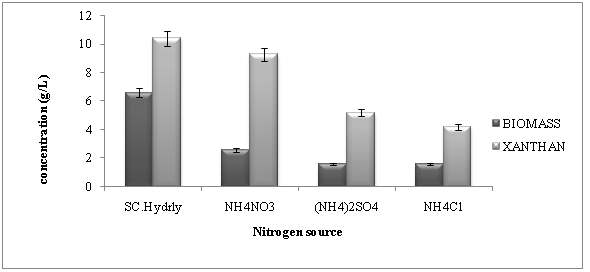
Nitrogen is also very important factor for xanthan production. Different nitrogen sources such as ammonium sulphate, ammonium nitrate, ammonium chloride and soybean casein hydrolysates were tested in concentration of 1 g/L for biomass and xanthan production. Figure 3 shows biomass and xanthan gum content obtained. Maximum biomass and xanthan content of 3.11g/L and 10.3 g/L was obtained in case of soybean casein hydrolysates in Pseudomonas aeruginosa followed by ammonium nitrate as shown in Figure 3.
Figure 3: Effect of different nitrogen sources on cell mass and xanthan production by Pseudomonas aeruginosa (SD ± 0.5).
Design of Experiment
Response surface methodology was employed to check the best operating conditions for enhanced xanthan production. Three process variables viz; carbon concentration, nitrogen concentration and agitation speed were chosen at five levels and then twenty sets of experiments were designed by design expert 8.0.7 software tool using central composite rotatable design (CCRD) (Table 1).
Model fitting
Design matrix in coded terms with 8 factorial points, 6 axial points and 6 central points are presented in the Table 1. Table 2 represented the experimental results of xanthan content in the Pseudomonas aeruginosa by the CCRD. Maximum and minimum PHB content of 5.7 and 17g/L were obtained in the trial no 3 and 17, respectively at different combinations of carbon concentration (12.96 - 97.04), nitrogen concentration (0.36 - 6.36) and agitation speed (69.9 - 234 rpm) (Table 2). The regression analysis of experimental design demonstrated that the linear model (A, B and C) and quadratic model (AB, BC, AC and A2) were significant (p < 0.05) (Table 3).
Table 3: Anova Table.
| Source | Sum of squares | df | Mean square | F- Value | Prob > F |
|---|---|---|---|---|---|
| Model | 92.36 | 9 | 10.26 | 6.88 | 0.0029 |
| Carbon concentration(A) | 12.56 | 1 | 12.57 | 8.43 | 0.0158 |
| Nitrogen concentration | 11.24 | 1 | 11.24 | 7.53 | 0.0207 |
| Agitation speed | 14.77 | 1 | 14.77 | 9.90 | 0.0104 |
| AB | 1 | 14.31 | 9.59 | 0.0113 | 0.0113 |
| AC | 1 | 9.33 | 6.26 | 0.0314 | 0.0314 |
| BC | 1 | 17.58 | 11.79 | 0.0064 | 0.0064 |
| A2 | 1 | 7.17 | 4.81 | 0.0531 | 0.0531 |
| B2 | 1 | 0.99 | 0.67 | 0.4334 | 0.4334 |
| C2 | 1 | 4.12 | 2.76 | 0.1274 | 0.1274 |
| Residual | 14.92 | 10 | 1.49 | - | - |
| Lack of fit | 12.32 | 5 | 2.46 | 4.75 | - |
| Pred R-squared | 0.4991 | ||||
| Adj R squared | 0.8514 | ||||
| Adequate Precision | 13.434 |
Applying multiple regression analysis, the results were fitted to second order polynomial equation. Xanthan content fitted in the terms of coded variables was obtained as follows:
Y(Xanthan) = + 8.94 + 0.96 * A + 0.96 * B + 1.04 *C + 1.34*A
*B + 1.08 *A*C. + 1.48*B *C – 0.70 * A2 – 0.31 *B2 + 0.53 *C2.
Where, Y is the response in terms of xanthan content. Coded terms A, B and C represents, carbon concentration, nitrogen concentration and agitation speed, respectively. ANOVA of results of quadratic models are represented in Table 3. The model F-value of 6.88 depicts that model was significant. Lack of fit value of 4.74 implies that the lack of fit was not significant relative to pure error.
Interactive effect of process factors on xanthan gum production
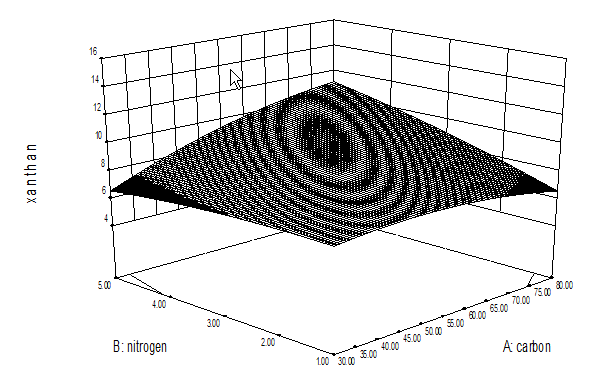
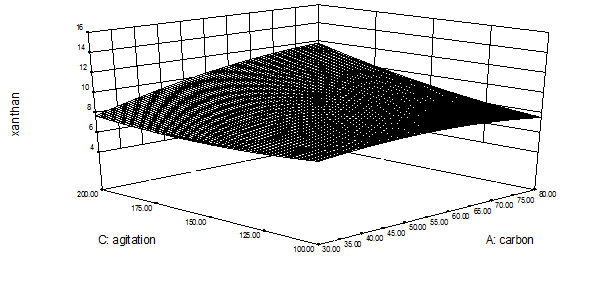
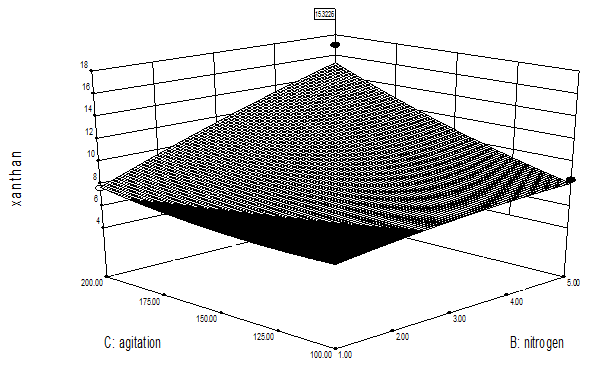
Table 2 represents the interactive effect of different process variables on xanthan production. Figure 4 represents the interactive effect of carbon-nitrogen concentration on xanthan production.3D surface Figure (4a) clearly indicates that with increase in carbon concentration xanthan production increased upto 55 g/L however, further increase caused decrease in xanthan and increase in nitrogen concentration resulted in little increase in xanthan production upto 5 g/L. Figure (4b) represents the interactive effect of nitrogen concentration and agitation speed, figure indicates that increase in nitrogen concentration caused increase in xanthan production and increase in agitation speed resulted in increased xanthan production. Figure (4c) represents the interactive effect of carbon concentration and agitation speed. It can be predicted from figure that with increase in carbon concentration xanthan gum production increased up to 55 g/L, further increase caused decrease however, with increase in agitation speed xanthan production increased. Interactive effect conformed the above findings. Interactive effect of carbon-nitrogen concentration, nitrogen concentration and agitation speed and carbon concentration and agitation was found to be significant (p < 0.05).
Result was verified by performing experiments in triplicates under optimized conditions. At 55 g/L carbon concentration xanthan gum production was highest (17 g/L), further increase or decrease reduced yield. This is due to the reason that increase in carbon concentration above 55 create increase in osmatic pressure and inhabit the enzymes responsible for xanthan production and similarly low concentrations does not initiate the enzymes responsible for xanthan biosynthesis .Current findings is an agreement with previous studies[7]. It was found that increased carbon concentration caused decrease in viscosity. In current study it was found that highest xanthan gum was obtained at increased agitation speed (200 rpm), decrease in agitation speed caused decrease in xanthan gum production .This is due to the reason that at low agitation speed, oxygen transfer limitation occurs which limited biomass as well as xanthan production. Current study is in according with results obtained in case of xanthomonas sp. Where it was found that highest viscosity was achieved at strongest agitation speed[8]. Nitrogen concentration of 5 g/L was considered as optimum for maximum xanthan gum production. Further increase or decrease caused decline in xanthan yield.
Figure 4(a): Optimization of levels of carbon – nitrogen concentration for xanthan gum production.
Figure 4(b): Optimization of carbon concentration and agitation speed for xanthan gum production.
Figure 4(c): Optimization of nitrogen and agitation speed for xanthan gum production.
Scale up in 7.5L bioreactor
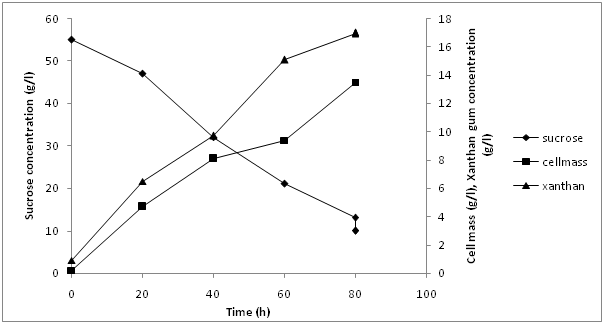
Scale up process was done in 7.5L bioreactor (BioFlo/Celligen 115, New Brunswick, USA) to study xanthan production in batch cultivation. Working volume of bioreactor was kept at 3L. Batch cultivation study was carried out to understand the kinetics of xanthan gum production under optimized conditions. Figure 5 represents the xanthan gum production under optimized conditions by Pseudomonas aeruginosa utilizing sucrose as carbon source and soyabean casein hydrolysates as nitrogen source with initial concentration of 55 g/L sucrose and 5 g/L soybean casein hydrolysates. pH 7 and DO 30% saturation value with agitation speed of 200 rpm. Figure 5 clearly depicts that after a lag phase of 12.0 h biomass increased to be 13.5 g/L at 72 h. Maximum xanthan production was found to be 17 g/L after 72 h of production. Total sugar concentration decreased to 10.2 g/L at the end of production phase in comparison to initial concentration of 55.0 g/L. Nitrogen source also depleted after 48 h of cultivation which leads to enhanced xanthan production. Xanthan yield (Yp/x) in terms of cell biomass produced were found to be 1.33 (g/g) maximum productivity was found to be 0.24 g/L hr. Previously, maximum xanthan was produced using sucrose as substrate in case of Xanthomonascampestris giving maximum yield of 3.5g/L[9]. The xanthan yield obtained in current study is much higher than previous reports.
Figure 5: Scale up in 7.5 L bioreactor.
Characterization of xanthan gum
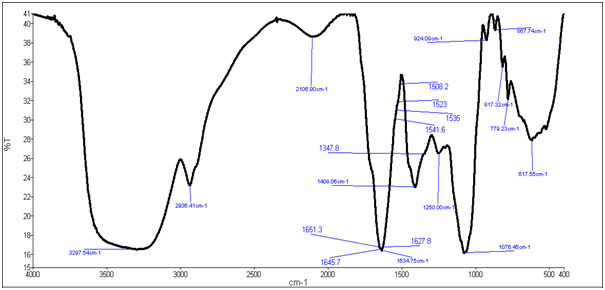
Characterization was done by FTIR (Fourier Transform Infrared Spectroscopy) analysis. FTIR spectra predict the presence of functional groups carbonyl, carboxyl and acetal groups in xanthan gum. The FTIR spectra was analyzed in order to confirm the practically identical structure of xanthan gum produced by Xanthomonascampestris NCIM 5028 with the biopolymer which was produced by Pseudomonas aeruginosa NCIM 2948 .In xanthan gum produced by Xanthomonascampestris (control) broad spectra at 3297.54 cm-1 indicates hydrogen bonded –OH groups. Two peaks, one at 617 cm-1 and other at 1408 cm-1 are attributed to –COO- groups. Additional characteristic absorption bands of xanthan gum appeared at 1076 cm-1 due to –OH bending. The peaks at 1408 cm-1 (C-O symmetric stretching) are due to carboxylate anion. 1634.75 cm-1 represents presence of acetyl group as shown in figure 6(a), where as figure 6(b) represents FTIR spectra of xanthan gum from Pseudomonas aeruginosa with broad spectra at 3397.72 cm-1 indicating hydrogen bonded –OH groups .Two peaks one at 615 cm-1 and other at 1403 cm-1 are attributed to –COO- groups. Additional characteristic bands of xanthan from Pseudomonas aeruginosa appeared at 1079 cm-1 due to –OH bending. C-O peak at 1403 cm-1 and acetyl group peak at 1635.04 cm-1. Functional groups of IR spectra of pure xanthan was identical to that of produced xanthan gum[10].
Figure 6(a): FTIR analysis of Xanthomonas campesteris xanthan.
Figure 6(b): FTIR analysis of Pseudomonasaeruginosa xanthan.
Discussion
In present study Pseudomonas aeruginosa was used as xanthan production strain and process was optimized by using the software (Design Expert 8.0.7, Stat-Ease Inc., USA) for increased productivity. Maximum production of 17g/L was obtained at 72 hr. of production. To produce xanthan gum, strain needs several nutrients include micronutrients(potassium, iron and calcium salts) and macronutrients (carbon and nitrogen sources)[11]. The current study finding are in correlation with previous finding where different carbon and nitrogen sources were tested and highest xanthan production was obtained in case of sucrose and soybean casein hydrolysates[12]. Scale up process under optimized conditions depicted that xanthan yield (Yp/x) in terms of cell biomass produced were found to be 1.33 (g/g). Maximum productivity was found to be 0.24 g/Lhr. FTIR revealed that chemical nature of xanthan produced is in co- relation with previous findings[13].
Conclusion
Xanthan gum produced by Pseudomonas aeruginosa using sucrose and casein hydrolysate as carbon source and nitrogen source. The FTIR Spectra of xanthan gum produced by selected stain resembled the functional groups of the xanthan produced by Xanthomonascampestris. The current findings show that maximum xanthan gum yield can be obtained under optimized condition comprising: 55 g/L sucrose, 5g/L soyabean casein hydrolysates and 200 rpm agitation speed.
Acknowledgement
We would like to acknowledge our sincere thanks to department of chemistry, Banaras Hindu University for providing FTIR unit to accomplish this work.
References
1. Margaritis, A., Zajic, J.E. Biotechnology Review: Mixing mass transfer and scale up of polysaccharide fermentation. (1978) Biotechnol Bioeng 20: 939-1001.
2. Baird, J.K. Xanthan, in: Encyclopedia of polymer Sciences. (1989) Engineering 17: 901-918.
Pubmed||Crossref||Others
3. Garcia-Ochoa, F., Santos, V.E., Casas, J.A., et al. Xanthan gum: Production/ Recovery and properties. (2000) Biotechnol Adv 18: 549-579.
4. Kennedy, J.F., Bradshaw, I.J. Production, properties and application of xanthan. (1984) Prog Ind Microbiol 19: 319-371.
Pubmed||Crossref||Others
5. Márcia de Mello Luvielmo., Claire TondoVendruscolo., Adilma Regina PippaScamparini. Selection among strains of Xanthomonascampestris for xanthan gum production. (2007) CienciasExatas e Tecnologicas, Londrina 28(2): 161-172.
Pubmed||Crossref||Others
6. Rangarajana, V., Shanmughamb, P., Narayanan, M. Optmization of Xanthan Production by Xanthomonascampestris -NCIM 2961 using Response Surface Methodology and Characterization of Purified Xanthan. (2012) Int J App Biotechnol Biochem 2(1): 1-17.
Pubmed||Crossref||Others
7. Garcoaa, O.F., Santosa, V. E., Casasb, J.A., et al. Xanthan gum: production, recovery, and properties. (2000) Biotechnol Adv18: 549 -579.
8. Borges, C.D., Moreira, A.S., Vendroscola, C.T., et al. Influence of agitation and aeration in xanthan production by xanthomonascampestris pv pruni strain 101. (2008) Rev Argent Microbial 40(2): 81-85.
9. Kumara, S.M., Khan, B.A. Effect of carbon and nitrogen sources on the production of xanthan gum from xanthomonascampestris isolated from soil. (2012) Archives of App Sci Res 4(6): 2507-2512.
Pubmed||Crossref||Others
10. Gilani, S.L., Najafpour, G.D., Heydarzadeh, H.D., et al. Models for xanthan gum production using xanthomonascampestris from molasses. (2011) Chemical Industry & Chemical Engineering Quarterly 17(2): 179−187.
11. Anbuselvi, S., Sathish, K.M., VIkram, M., et al. A comparative study on biosynthesis of xanthan gum using three different xanthomonas strains isolated from diseased plants. (2012) Int J Pharma Bio Sci 3(3): 1-6.
Pubmed||Crossref||Others
12. Selva, M.T., Babitha, R. Influence of nutritional factors on xanthan production by Xanthomonasmalvacearum. (2011) Archives Appl Sci Res 2(6): 28-36.
Pubmed||Crossref||Others
13. Lachke, A.A. Efficient simultaneous saccharification and fermentation of agricultural residues using Saccharomyces cerevisiae and Candida shehatae - The D-xylose fermenting yeast. (1990) Appl Biochem Biotechnol 26(2): 151-158.


