The Determination of Uric Acid in Human Saliva by Liquid Chromatography with Electrochemical Detection
Kevin Honeychurch
Affiliation
Centre for Research in Analytical, Materials and Sensors Science, Department of Applied Sciences, University of the West of England, Bristol, Frenchay Campus, Coldharbour Lane, istol, UK
Corresponding Author
Kevin C. Honeychurch, Centre for Research in Analytical, Materials and Sensors Science, Department of Applied Sciences, University of the West of England, Bristol, Frenchay Campus, Coldharbour Lane, Bristol, BS16 1QY, UK, Tel: +44 (0)117 3287357; E-mail: kevin.honeychurch@uwe.ac.uk
Citation
Honeychurch, K.C. The Determination of Uric Acid in Human Saliva by Liquid Chromatography with Electrochemical Detection. (2017) J Anal Bioanal Sep Tech 2(1): 47- 51.
Copy rights
© 2017 Honeychurch, K.C. This is an Open access article distributed under the terms of Creative Commons Attribution 4.0 International License.
Keywords
Uric Acid; LC-ECD; Human Saliva; Oxidative Stress
Abstract
A method employing high-performance liquid chromatography with electrochemical detection (LC-ED) has been successfully developed for the determination of uric acid in human salvia. The optimal chromatographic conditions were found to comprise a mobile phase containing 5 % methanol, 95 % 50 mM trichloroacetic acid, adjusted to pH 2.7, in conjunction with a Hypersil C18 250 mm x 4.6 mm column at a flow rate of 0.6 mL min-1. Hydrodynamic voltammetric studies were undertaken to optimize the operating potentials required for electrochemical detection. It was found that an applied potential of +1.2 V was optimum for the determination of uric acid. The proposed method was evaluated by carrying out replicate uric acid determinations on spiked and unspiked human saliva samples (%CV = 8.8 %). The data suggest that the method holds promise for clinical applications.
Introduction
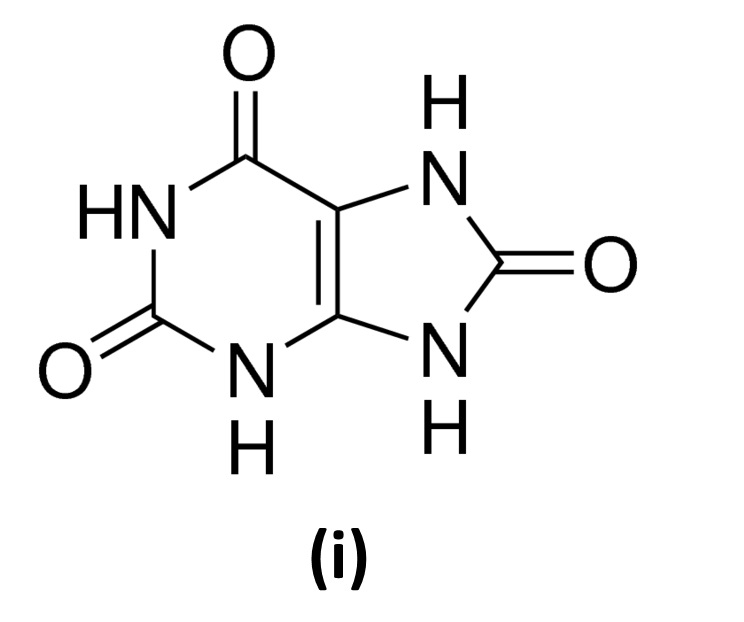
The aim of the current study was to investigate the possibility of determining uric acid (2,6,8-trihydroxypurine) (I) in human saliva using high performance liquid chromatography and electrochemical detection (LC-ECD).
The study of uric acid is important as it represents one of the most important antioxidants in humans contributing to more than 70 % of the total antioxidants present in human saliva[1]. In fact, humans and other higher apes exhibit relatively high levels of uric acid and in blood it is near its solubility point. Relatively small increases can lead to illness such as gout, the prevalence and incidence of which has been reported to be increasing in the UK[2]. Nevertheless, it has been suggested that these high levels of uric acid are one of the reasons for our lengthen life spans compared to many other species and there is debate on the relative health effects of uric acid[3,4]. However, uric acid has also been shown to be associated with conditions such as, type 2 diabetes[5], congestive heart failure, hyperuricemia obesity, hypertension[6], depression[7], cognitive ability[8], Lesch-Nyhan syndrome[9] and kidney stone formation[10].
Levels of uric acid in saliva for healthy individuals would appear to vary, but generally are in the mid to high μM range. Owen-Smith et al.[11] have shown uric acid levels in the saliva of healthy individuals to be in the range of 120 μM to 400 μM with levels as high as over 1 mM were found in the saliva of gout suffers.
As a reflection of the importance of monitoring uric acid, various analytical techniques have been utilised for its determination. Table 1 summaries a number of recent chromatographic approaches utilised for the determination of uric acid. HPLC coupled with electrochemical detection is relatively straightforward and highly sensitive requiring no derivatisation step or expensive sophisticated equipment. In this study we have chosen to investigate the levels of uric acid in human saliva as this has a number of practical advantages over that of blood and plasma both in terms of non-invasive nature of sample collection and the greater willingness of individuals to donate such samples.
Our present proof-of-concept study was divided into three parts. Initially, we optimized the HPLC conditions needed for the separation of uric acid on a C18 reversed-phase column and optimized the electrochemical conditions required via hydrodynamic voltammetry. Finally, we investigated the possibility of using the optimized system for the determination of uric acid in human saliva samples.
Experimental
Chemicals and Reagents
All standard reagents were purchased from Fisher Scientific or BDH and used as received. Deionised water was obtained from a Purite RO200-Stillplus HP System, (Purite, Oxon, UK). Uric acid was obtained from Sigma Aldrich (Poole, Dorset, UK). Stock solutions were made by dissolving the required mass in 20 mM NaOH. Human saliva was obtained from a healthy volunteer after fasting for one hour.
Apparatus
Cyclic voltammetry (CV) was performed with a Sycopel Scientific AEW2 potentiostat interfaced to a PC for data acquisition and processing using the Electrochemistry Program version 3.00 (both Sycopel Scientific Ltd, Tyne and Wear, UK).
High-Performance Liquid Chromatography
HPLC studies were undertaken using a system consisting of an IsoChrom pump (Spectra Physics), with a 250 mm x 4.6 mm Hypersil Hypurity C18, 5 μm column connected to a 7125 valve manual injector fitted with a 50 μL sample loop (Rheodyne, Cotati, CA). Sample extracts were analyzed using a mobile phase consisting of 50 mM trichloroacetic acid, adjusted to pH 2.7 with sodium hydroxide modified with 5 % methanol at a flow rate of 0.6 mL min-1.
Electrochemical Detection
The detector cell was obtained from BAS (Congleton, Cheshire, U.K.) The cell consisted of a two-piece thin-layer cell, formed from an upper Teflon block containing a glassy carbon electrode (3 mm diameter), and a bottom steel block serving as the pseudo reference/counter electrode. Teflon gaskets were purchased from BAS. An EG&G Princeton Applied Research (Princeton, NJ) model 362 scanning potentiostat was used to control the potential at +1.2 V versus the pseudo reference/counter steel electrode. Chromatograms were recorded using a Siemens Kompenosograph X-T C1012 chart recorder.
Hydrodynamic Voltammetry (HDV)
HDV was performed by injecting fixed volumes of a standard solution of uric acid and varying the applied potential between + 0.5 and + 1.5 V. HDVs were constructed by plotting the recorded peak current for a fixed concentration against the applied potential. The optimum potential was determined from the position of the plateau of the hydrodynamic wave.
Table 1: HPLC and related approaches to the determination of uric acid in human saliva and human body fluids.
| Sample | Detection Limit | Linear Range | Analytical Technique | Reference | |
|---|---|---|---|---|---|
| Uric acid | Human urine and saliva | 0.21 ng | 0.7–100 ng of UA (0.07–10 mg/L, taking into account the sample volume injected). | LC/MS. Anion exchange chromatography. | [14] |
| Uric acid | Human saliva | 3 nM for amperometric and 6 nM for coulometric detection | 60 to 6000 nM | Reversed-phase HPLC with electrochemical detection. | [15] |
| Uric acid, salivary peptides histatins 1, 3, 5 and statherin | HPLC with diode-array detection. | [16] | |||
| Uric acid | Serum | 0.032 ng | 6.0 to 200 mg/kg | Isotope dilution coupled with liquid chromatography/mass spectrometry electrospray ionization. | [17] |
| Uric acid | Human urine | 0.02 mg/L | 0.25 to 100 mg/L | Ion-exclusion column using water as mobile phase. UV detection at 254 nm. | [18] |
| Uric acid | Gout patients' plasma and urine | 0.5 μg/mL | 5 to 200 μg/mL | Microemulsion electrokinetic chromatography. | [19] |
| Uric acid | Human urine | 0.5 μg/L | 0.10 to 20 mg/L | Ion chromatography with conductivity detection. | [20] |
| Uric acid | Dental calculi | -- | -- | LC/MS | [21] |
| Uric acid | Human urine | 0.3 μM | 1 to 100 μM | Flow injection analysis with UV detection at 735 nm based on the reduction of Prussian Blue. | [22] |
Sample Preparation
Approximately 1 to 2 mL of human salvia was collected from a healthy human volunteer in a 2 mL Eppendorf tube. This was sonicated for 15 minutes to destroy any cells that could be present[12,13]. A suitable aliquot of this was diluted ten times in mobile phase and then syringe filtered (PTFE, 0.2 μm). The resulting solution was then introduced to the LC-ECD system. Quantification was achieved by external calibration.
Results and Discussion
Liquid Chromatographic separation of Uric Acid
Initial studies were made using a mobile phase consisting of 50 mM phosphate pH 3.0 buffers with 0.1 % EDTA at a flow rate of 1.0 mL/min. Under these conditions uric acid was found to co-elute with reduced glutathione (GSH). Milton and Trevithick[23] utilised a mobile phase of chloroacetic acid and trichloroacetic acid (TCA) adjusted to pH 2.7, modified with 2 % methanol, for the determination of GSH in vertebrate lens fluid. It was believed that a similar approach could be used to separate GSH and uric acid. The pka values of uric acid and GSH are known to be 3.89 and 2.12 respectively, hence at pH 2.7, GSH would be expected to be in its ionic from, and hence from an ion pair with trichloroacetic acid. However, under the same conditions, uric acid would not be ionised, and so not form an ion-pair with the trichloroacetic acid, allowing for a mechanism to separate the two analytes. Investigations showed that an organic modifier concentration of 2 % methanol was insufficient to stop collapse of the stationary phase and so was increased to 5 % and consequently a mobile phase of 5 % methanol, 95 % 50 mM TCA adjusted to pH 2.7 was found to optimal, and was used in further studies.
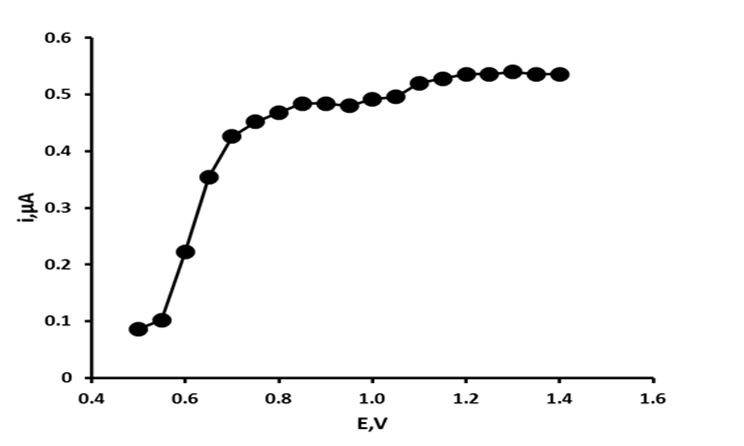
Figure 1: Hydrodynamic voltammogram of uric acid.
Hydrodynamic Voltammetric Studies
The electrochemical behaviour of uric acid has been understood for some time[24]. It is known to undergo an irreversible 2e , 2H+ oxidation to form the corresponding unstable 4,5-diol, which then hydrolyses to the electrochemically inactive allantoin. To identify the optimum applied potential required for the determination of uric acid hydrodynamic voltammograms were constructed over the potential range + 0.5 V to + 1.4 V. Figure 1 shows the resulting HDV for uric acid. Uric acid was found to give a potential dependant response between + 0.5 V and + 0.75 V, with current response above this potential forming two plateaus between + 0.80 V and + 1.0 V and + 1.0 V and + 1.4 V. Consequently, an applied potential of + 1.2 V was used in further investigations.
Effect of Flow Rate
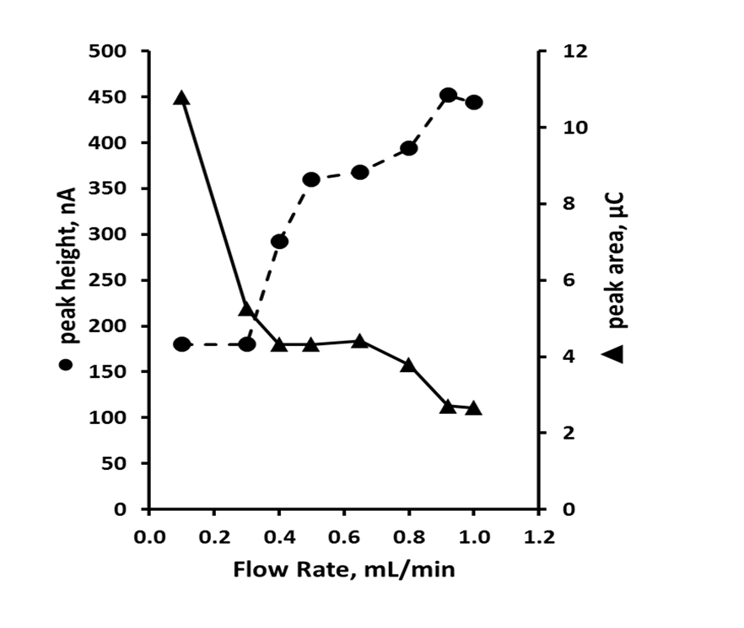
Studies have demonstrated that the sensitivity of an amperometric detector is dependent on flow rate[25], and the effects of this parameter were studied over the range 0.1 mL min-1 to 1.0 mL min-1 (Figure 2). Peak height was seen to increase with flow rate from 0.1 mL min-1 to 0.6 mL min-1; beyond on this value peak height became independent of the flow rate. Below flow rates of 0.4 mL min-1, the current response moved from amperometric to approaching more coulometric values. However, using such low flow rates resulted in excessively long retention times, and hence further studies were undertaken using a flow rate of 0.6 mL min-1 as this gave the best balance between sensitivity and chromatographic performance.
Figure 2: Effect of flow rate on peak height ● and peak area ▲ for uric acid. Chromatographic conditions: 95 % TCA pH 2.7, 5 % methanol, +1.2 V.
Studies of Possible Interferences
Paracetamol, aspirin, salicylic acid, caffeine, xanthine, hypoxanthine, L-ascorbic acid, L-cysteine, urea, phenyl red, tyrosine, indole and reduced glutathione (GSH) were investigated as possible interferences under the optimized LC-ECD parameters. Paracetamol, indole, L-cysteine, xanthine, hypoxanthine and L-ascorbic acid were found to give oxidative responses, at concentrations of 0.1 mM. However, these were removed from the retention times of uric acid, and hence did not interfere.
Calibration Plot, Limit of Detection, and Precision
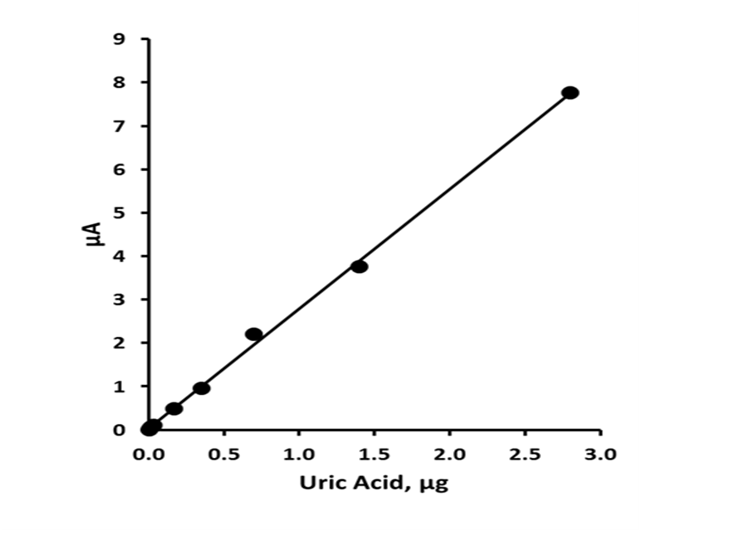
Standard solutions containing uric acid in the concentration range 0.0 - 1.0 mM were prepared in mobile phase and determined by the optimized LC-ECD procedure. The calibration plot (figure 3) was found to be linear from 3.4 ng to 2.8 μg, injected on column with a slope of 2.761 nA/ng, with an R2 value of 0.9987 for uric acid. The limit of detection was calculated by making replicate current measurements at the appropriate retention times uric acid (n = 5) for a blank solution; the detection limit based on three times the mean of these measurements gave a value of 1.0 ng on column.
Figure 3: Calibration curve for uric acid. Chromatographic conditions: 95 % TCA pH 2.7, 5 % methanol, 0.6 mL min-1, +1.2 V.
Analytical Application
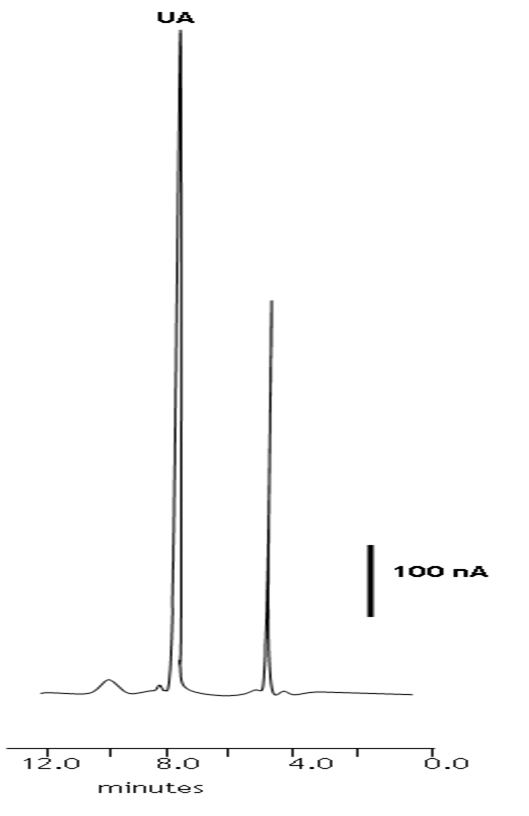
To assess the performance of the LC-ECD, seven replicate determinations of uric acid in spiked and unspiked human saliva samples were undertaken. Aliquots of the saliva were prepared using the procedure described in the sample preparation section. Quantification was achieved by external calibration. Figure 4 shows representative chromatogram of an unadulterated human saliva extract. Uric acid (RT = 7.9 min) were well resolved from other endogenous saliva components and a mean uric acid concentration of 234.5 μM (% CV = 4.1 %) was found. Recoveries and precision gained for a 120 μM uric acid fortification of the original sample are summarized in Table 2. The method can be seen to give reliable data at the concentrations investigated here.
Figure 4: Representative chromatogram of an unadulterated human saliva sample obtained by LC-ECD. Chromatographic conditions: 95 % TCA pH 2.7, 5 % methanol, 0.6 mL min-1, +1.2 V. UA = uric acid.
Table 2: Precision and recovery data for uric acid in human saliva.
| Uric Acid | ||||
|---|---|---|---|---|
| Native, μM | Added, μM | Found, μM | % Recovery | |
| 1 | 234.5 | 120.0 | 357.3 | 102.3 |
| 2 | 234.5 | 120.0 | 347.3 | 94.0 |
| 3 | 234.5 | 120.0 | 347.3 | 94.0 |
| 4 | 234.5 | 120.0 | 347.3 | 94.0 |
| 5 | 234.5 | 120.0 | 347.3 | 94.0 |
| 6 | 234.5 | 120.0 | 327.5 | 77.5 |
| mean | 92.6 | |||
| sd | 8.1 | |||
| %CV | 8.8 |
Conclusion
An assay involving LC-ECD has been successfully developed for the determination of endogenous levels of uric acid in human saliva. The chromatographic separation is achieved using an octadecyl reversed-phase column in conjunction with methanolic trichloroacetic acid as the mobile phase. Little sample pre-treatment was required other than simple dilution of the sample in mobile phase and its subsequent filtration, before introduction to the HPLC system. Therefore, this assay should be readily applicable to the monitoring of these compounds in relation to oxidative stress and other diseases in humans. This demonstrates several advantages over previously reported methods, as these require more extensive sample preparation, such as solid phase extraction and centrifugation[15]. It should be noted that further studies have been made on human urine and we have found it possible to successively determine endogenous levels of uric acid using the same sample preparation and LCECD conditions described here. In further studies the levels ofuric acid present in the saliva of gout suffers or haemodialysis patients will be investigated using the developed method. Alternative stationary phase technologies will also be investigated to overcome possible issues with the low pH of the mobile phase employed.
Acknowledge:
I am grateful to the University of the West of England.
References
- 1. Moore, S., Calder, K.A.C., Miller, N.J., et al. Antioxidant activity of saliva and periodontal-disease. (1994) Free Radic Res 21(6): 417-425.
- 2. Kuo, C.F., Grainge, M.J., Mallen, C. Et al. Rising burden of gout in the UK but continuing suboptimal management: a nationwide population study. (2014) Ann Rheum Dis 74(4): 661-667.
- 3. Proctor, P.H. Uric Acid: Neuroprotective or Neurotoxic? (2008) Stroke 39(5): e88.
- 4. Dawson, J., Quinn, T., Lees, K., et al. The continued Yin and Yang of uric acid. (2008) Stroke 39(1): e9.
- 5. Dehghan, A., van Hoek, M., Sijbrands, E.J., et al. High serum uric acid as a novel risk factor for type 2 diabetes. (2008) Diabetes Care 31(2): 361–362.
- 6. Dobson, A. Is raised serum uric acid a cause of cardiovascular disease or death?. (1999) Lancet 354(9190): 1578.
- 7. Wen, S., Cheng, M., Wang, H., et al. Serum uric acid levels and the clinical characteristics of depression. (2012) Clin Biochem 45(1-2): 49–53.
- 8. Li. Dong, B.R., Lin, P., et al. Association of cognitive function with serum uric acid level among Chinese nonagenarians and centenarians. (2010) Exp Geront 45(5): 331–335.
- 9. Luo, Y.C., Do, J.S., Liu, C.C. An amperometric uric acid biosensor based on modified Ir-C electrode. Biosens. (2006) Bioelectron 22(4): 482–488.
- 10. Friedlander, J.I., Moreira, D.M., Hartman, C., et al. Comparison of the metabolic profile of mixed calcium oxalate/uric acid stone formers to that of pure calcium oxalate and pure uric acid stone formers. (2014) Urology 84(2): 289-294.
- 11. Owen-Smith, B., Quiney, J., Read, J. Salivary urate in gout, exercise, and diurnal variation. (1998) Lancet 351(19120): 1932.
- 12. Benov, L., Al-Ibraheem, J. Disrupting Escherichia coli: A comparison of methods. (2002) J Biochem Mol Biol 35(4): 428-431.
- 13. Sharif, E., Kiely, J., Luxton, R. Novel immunoassay technique for rapid measurement of intracellular proteins using paramagnetic particles. (2013) J Immunol Methods 388(1-2): 78–85.
- 14. Perelló, J., Sanchis, P., Grases, F. Determination of uric acid in urine, saliva and calcium oxalate renal calculi by high-performance liquid chromatography/mass spectrometry. (2005) J Chromatogr B Analyt Technol Biomed Life Sci 824(1-2): 175–180.
- 15. Inoue, K., Namiki, T., Iwasaki, Y., et al. Determination of uric acid in human saliva by high-performance liquid chromatography with amperometric electrochemical detection. (2003) J Chromatogr B Analyt Technol Biomed Life Sci 785(1): 57-63.
- 16. Castagnola, M., Congiua, D., Denottic, G., et al. Determination of the human salivary peptides histatins 1, 3, 5 and statherin by high-performance liquid chromatography and by diode-array detection. (2001) J Chromatogr B Analyt Technol Biomed Life Sci 751(11): 153–160.
- 17. Dai, X., Fang, X., Zhang, C., et al. Determination of serum uric acid using high-performance liquid chromatography (HPLC)/isotope dilution mass spectrometry (ID-MS) as a candidate reference method. (2007) J Chromatogr B Analyt Technol Biomed Life Sci 857(2): 287-295.
- 18. Hou, S.J., Yang, C.D., Wang, H., at al. Ding, Determination of uric acid in human urine by ion-exclusion chromatography with UV detection using pure water as mobile phase.( 2012) Chin J Chem 30(5): 1102-1104.
- 19. Lin, X., Wang, Y.F., Sun, J.Y., et al. Determination of uric acid in human plasma and urine by microemulsion electrokinetic chromatography. (2013) Anal Methods 5: 5201-5207.
- 20. Zhao, F.Y., Wang, Z.H., Wang, H., et al. Determination of uric acid in human urine by ion chromatography with conductivity detector. (2011) Chin Chem Lett 22(3): 342–345.
- 21. Shibasaki, K., Kimura, M., Ikarashi, R., et al. Uric acid concentration in saliva and its changes with the patients receiving treatment for hyperuricemia. ( 2012) Metabolomics 8(3): 484–491.
- 22. Waseem, A., Yaqoob, M., Nabi, A., et al. Flow-injection spectrophotometric determination of uric acid in urine via Prussian Blue reaction. (2011) Chem Res Chinese U 27(6): 923-933.
- 23. Milton, K., Trevithick, J.R. High-performance liquid chromatography-electrochemical detection of antioxidants in vertebrate lens: glutathione, tocopherol and ascrobate. (1994) Methods Enzymol 233: 523-530.
- 24. Dryhurst, G. Electrochemical oxidation of uric acid and xanthine at the pyrolytic graphite electrode: mechanistic interpretation of electrochemistry. (1972) J Electrochem Soc 119(12): 1659-1664.
- 25. Štulík, K., Pacáková, V. Electroanalytical measurements in flowing liquids. (1987) Ellis Horwood


