Comparison of the kinetics of glucose response after oral glucose tolerance test and a standardised breakfast in obese patients with the use of cgm
Marinos Fysekidis*, Amel Rezki, Emmanuel Cosson, Paul Valensi
Affiliation
Department of Endocrinology, Diabetology, Nutrition, JeanVerdier Hospital, AP-HP, CRNH-IdF, CINFO, Paris Nord University, Bondy, France
Corresponding Author
Marinos Fysekidis, Department of Endocrinology, Diabetology, Nutrition, JeanVerdier Hospital, Avenue du 14 Juillet, 93143 Bondy cedex, France, Tel : (Int)+33 (0)148026580/ +33 (0)148026356 ; E-mail : fisekidis_marinos@hotmail.com
Citation
Fysekidis, M., et al. Comparison of the Kinetics of Glucose Response after Oral Glucose Tolerance Test and a Standardised Breakfast in Obese Patients with the Use of CGM. (2020) J diab Obes 6(1): 13-18.
Copy rights
© 2020 Fysekidis, M. This is an Open access article distributed under the terms of Creative Commons Attribution 4.0 International License.
Keywords
CGM, Glucose peak delay, Oral glucose tolerance test, Standard breakfast
Abstract
Background: The oral glucose tolerance test (OGTT) is the reference method for classification of hyperglycemia. Standardized meals bear resemblance to physiological nutrient ingestion. The aim of the present study was to study with the use of continuous glucose monitoring (CGM) the glucose curve after standardized breakfast and determine if glucose kinetics were comparable to an OGTT.
Methods: Seventy-two obese subjects without known hyperglycemia were included. A blinded CGM device was placed at least 2 hours before the OGTT.Fifty-five participants accepted to receive a standardised breakfast providing 75 grams of carbohydrates. Subjects were classified as normoglycemic (NGT, n=25), impaired fasting glucose or impaired glucose tolerance (IFG /IGT, n=21) and type 2 diabetic (T2D, n=9) according to OGTT.
Results: For all55 participants, the 120-minute Area under the Curve for glucose (AUC) after OGTT and standardised breakfast was similar (977 ± 257 vs 931 ± 238 mmol*min/L, p=0.075).Both AUCs were highly correlated (R²= 0.504, p<0.001). The time to the glucose peak was longer after OGTT than after breakfast (70.1 ± 30.8 vs 59.3 ± 22.4 min, respectively, p=0.020), and specifically in IGT (p=0.003) and T2D (p=0.037) but not in NGT patients (p=0.939). Interstitial glucose levels at 120 minutes were higher after OGTT than after breakfast (8.2 ± 2.5 vs 6.8 ± 2.0 mmol/L, p<0.001), and differed according to glycemic status (interaction, p=0.022).
Conclusions: The use of CGM for the study of glucose response curve after a standardized breakfast can provide valuable information, closer to real life conditions. Further studies validating reproducibility and adjusting for the values of interstitial glucose are necessary.
Introduction
The two-hour oral glucose tolerance test (OGTT) with 75g of glucose was used for the first time ninety-five years ago[1], and hassince been used for the diagnosis and classification of hyperglycaemic states[2]. Althoughwidely used in clinical practice, theglucose solution has poor palatability,is associated with adverse symptoms[3], and the glucose test has weak reproducibility[4,5]. Other disadvantages include the absence of the cephalic phase of insulin secretion, a more rapid gastric emptying than for solid meals (associated with a more pronounced gastric incretin response),and that OGTT often induces a late post-load hypoglycemia[6,7].
Standardized meals bear resemblancetophysiologicaldaily habits of nutrient ingestion, and have also beenvalidatedfor the calculation of insulin resistance indices[8]. Standardized mealshave also been used for diagnostic purposes compared toOGTT plasma glucose levels over a two-hour period[3]. The differences in proteins, lipids, carbohydrates, energy meal and even the time of day of the ingested meals can make comparison difficult[9].
The delay of glucose peak and the shape of the glucose curvein response to glucose intakehave been reported to be related to insulin secretion and sensitivity[10]. Previous studies have used five to seventime points during an OGTT, or used them separately and thereby did not consider different curve features.
Continuous glucose monitoring (CGM) is established as an important tool for the management of diabetes treatment. Its use addresses many of the limitations inherent in HbA1c testing and self-monitoring of blood glucose (SMBG) and is associated with a reduction in HbA1c in individuals with type 1 and type 2 diabetes mellitus[11,12]. Recently, the accuracy of CGM has reached a point where we can even consider the replacement of SMBG[13].
Therefore, CGM use can add precision and simplify the study of interstitial glucose kinetics after glucose or carbohydrate intake, without the use of sophisticated laboratory equipment in real life situations. The objective of the current study was to compare the kinetics of interstitial glucose during the OGTT and after a standardised breakfastusing CGM.
Patients
Patients and methods have previously been reported[14]. Briefly, in the original prospective study 72 obese patients without known hyperglycemia or glucose lowering treatment were recruited between March 2006 and December 2010. All participants gave informed consent. The main objective of the previously published study was to evaluate postprandial glucose contribution to HbA1c in obese subjects. All tests were performed in the department of Endocrinology-Diabetology-Nutrition of Jean Verdier hospital. Participants were instructed not to engage in any physical activity, to always use the hospital’s elevators and to remain inside their hospital room for the first 24 hours of the study.On the first day, the blinded CGM device (Medtronic, Northridge, CA) was placed in the early morning, at least two hours before the OGTT. Interstitial glucose readings were validated with three to four capillary glucose measurements, following the manufacturer’s guidelines, and recordings were considered of good quality when there was no more than 20 minutes of missing data. The OGTT was performed on the morning of the first day, after a 12-hour fast, for the diagnosis of glycemic status normoglycemia, (NGT) impaired fasting glucose (IFG) or impaired glucose tolerance (IGT) and diabetes (T2D). The test consisted of plasma glucose measurements at fasting and at 120 minutes after drinking 75 g of anhydrous glucose dissolved in 200 ml of water, drunk within 5 minutes. IFG, IGT and T2D were diagnosed according to the 2008 American Diabetes Association criteria[14]. The 2009 revised IDF criteria were used for the definition of the metabolic syndrome[15]. On the second day,55 of these patients accepted to receive a standardised breakfast, consisting of 100 ml of coffee or tea, 60 grams of bread, 30 grams of jam and 200 ml of orange juice (the breakfast provided 75g carbohydrates). The patients were instructed to note the exact time of their meals during the study, and meals were ingested within 10 minutes. The CGM device was removed on the morning of the third day. The 120-minute Area Under the Curve for glucose (AUC) on an individual levelwas calculated using the trapezoidal rule for each five-minute period.
Statistical analyses
Statistical analyses were performed with the SPSS statistical software (version 13.0, Chicago, IL, USA). Variables were expressed as means ± SD or as percentages. The Pearson correlation coefficient was used to test associations between continuous variables. Repeated measures ANOVA were used to compare OGTT and standardized breakfastglucose within subjects. The group of participants according to their glycemic status (NGT, IFG/IGT, T2D) represented the between-subjects factor. The effect of glycemic status was assessed with the presence of a statisticallyinteraction of OGTT or breakfast* glycemic status. Separate group analyses for NGT, IFG/IGT, T2D were performed with paired t-test between OGTT and breakfast. The chi square test was used for association between categorical variables.There was no missing data in patients that took the standardized breakfast.
Results
The main characteristicsfor the 55 patients are summarized in Table 1. According to OGTT they were separated in 3 groups: NGT (n=25), IFG and/or IGT(n=21) and T2D (n= 9). The 3 groups (NGT/IFG-IGT/T2D) differed for age, systolic blood pressure and the presence of metabolic syndrome. As expected, glucose metabolism indices including HbA1c, fructosamine, fasting plasma glucose value, 2-hour glucose value after OGTT, and Matsuda index were also different among the 3 groups. The Matsuda index was negatively correlated with the 120-minute AUC (OGTT, r=-0.426, p=0.002; breakfast, r = -0.365, p=0.015).
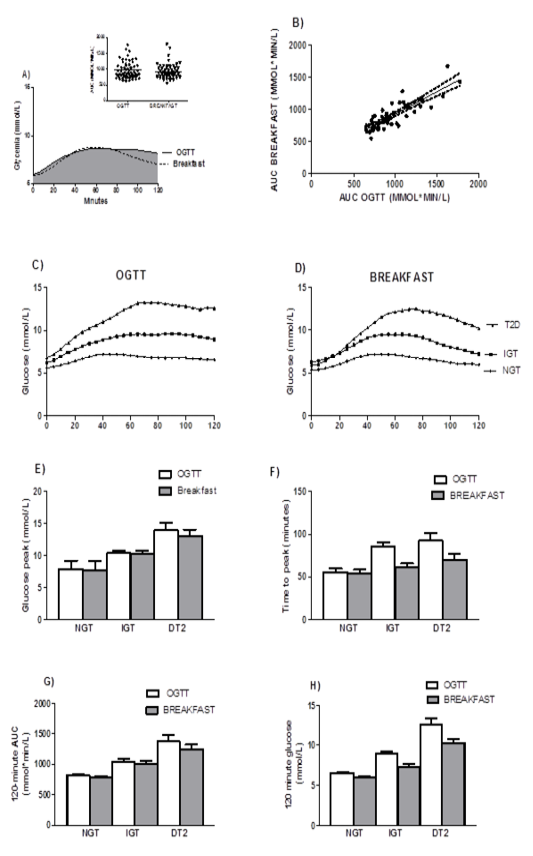
For all participants, theAUC forOGTT and standardised breakfast was similar (977 ± 257 vs 931 ± 238 mmol*min/L, p=0.075, Figure 1A). Both AUCs were highly correlated (R² = 0.504, p<0.001, Figure 1B). Interstitial glucose peak (i.e.maximum value) for both tests was not statistically different (9.6 ± 2.8 (OGTT) vs 9.4 ± 2.7 mmol/L (breakfast), p=0.371). The time to the glucose peak was longer after OGTT than after breakfast (70.1 ± 30.8 vs 59.3 ± 22.4 min, respectively, p=0.020) and interstitial glucose levels at 120 minutes were higher (8.2 ± 2.5 vs 6.8 ± 2.0 respectively, p<0.001).
Table 1: Patient characteristics.Data is presented as mean ± SD or n (%).
|
|
Total (n=55) |
NGT (n=25) |
IFG/IGT (n=21) |
T2D (n=9) |
P |
|
Age (years) |
47.4 ± 14 |
41.8 ± 12.9 |
51 ± 13.2 |
55.1 ± 13.8 |
0.013 |
|
GenderFemale, (%group) |
49 (87.5) |
22 (88) |
18 (86) |
9 (100) |
0.462 |
|
Body mass index (kg/m²) |
35.2 ± 6.1 |
35.3 ± 7.1 |
34.4 ± 4.8 |
36.7 ± 5.6 |
0.663 |
|
Waistcircumference (cm) |
104.5 ± 12.7 |
105.2 ± 15.3 |
102.8 ± 10.4 |
106.3 ± 10.7 |
0.776 |
|
Systolic Blood Pressure (mmHg) |
122.2 ± 15.2 |
119 ± 11.7 |
120.6 ± 16.9 |
136.6 ± 14.5§ |
0.011 |
|
Diastolic Blood Pressure (mmHg) |
71.2 ± 9.7 |
70.7 ± 7.3 |
69.5 ± 9.9 |
76.9 ± 14.6 |
0.180 |
|
Hypertension N (% group) |
23 (41.8) |
7 (28) |
11 (52) |
5 (56) |
0.132 |
|
Dyslipidemia N (%group) |
20 (36.4) |
9 (36) |
8 (38) |
3 (33) |
0.933 |
|
HbA1c (%) |
5.9 ± 0.4 |
5.7 ± 0.3 |
5.9 ± 0.4 |
6.4 ± 0.3** |
<0.001 |
|
HbA1c (mmol/mmol) |
41.0± 2.5 |
39.0± 1.5 |
41.4± 2.5 |
45.0± 2.0** |
|
|
Fructosamine (µmol/L) |
216 ± 25 |
206 ± 23 |
219 ± 22 |
238 ± 25§ |
0.003 |
|
Creatinine (µmol/L) |
71.9 ± 15.1 |
68.7 ± 13.0 |
76 ± 17.7 |
71.6 ± 13.7 |
0.269 |
|
Total Cholesterol (mmol/L) |
5.3 ± 0.8 |
5.2 ± 0.7 |
5.2 ± 1.0 |
5.8 ± 0.7 |
0.190 |
|
LDL cholesterol (mmol/L) |
3.4 ± 0.8 |
3.4 ± 0.7 |
3.3 ± 0.9 |
3.8 ± 0.6 |
0.257 |
|
Triglycerides (mmol/L) |
1.8 ± 0.9 |
1.7 ± 1 |
2.0 ± 1.0 |
1.5 ± 0.5 |
0.338 |
|
HDL cholesterol (mmol/L) |
1.1 ± 0.3 |
1.1 ± 0.4 |
1.1 ± 0.3 |
1.3 ± 0.2 |
0.120 |
|
Urinary albumin excretion rate (mg/24h) |
14.1 ± 15.6 |
17.8 ± 19.8 |
13.4 ± 14 |
8.9 ± 8.8 |
0.491 |
|
Fasting plasma glucose (mmol/L) |
5.2 ± 0.7 |
4.9 ± 0.4 |
5.3 ± 0.8 |
5.8 ± 1.0** |
0.007 |
|
2h OGTT plasma glucose (mmol/L) |
8.2 ± 2.3 |
6.4 ± 1.0 |
9.0 ± 1.0** |
12.0 ± 1.3** † |
<0.001 |
|
HOMA-IR |
3.0 ± 2.2 |
2.3 ± 1.9 |
3.6 ± 2.5 |
3.8 ± 2.0§ |
0.079 |
|
Matsuda Index |
5.6 ± 3.6 |
7.1 ± 3.9 |
4.7 ± 3.2§ |
3.4 ± 1.5§ |
0.015 |
|
Metabolic Syndrome N (%group) |
38 (69.1) |
12 (48) |
20(95) |
6 (67) |
0.002 |
HOMA-IR: Homeostasis Model Assessment of Insulin Resistance; IFG: Impaired Fasting Glucose; IGT: Impaired Glucose Tolerance; OGTT: oral glucose tolerance test. Metabolic syndrome was defined according to the 2009 International Diabetes Federation criteria. Multiple comparisons after Bonferroni adjustment for ANOVA: § p<0.05 vs NGT, **p<0.001 vs NGT, † p<0.001 vs IGT
After separate group analysis glucose peak was similar forOGTT compared to breakfast (NGT: 7.8 ± 1.3vs 7.7 ± 1.3 respectively, IFG-IGT 10.4 ± 2.1 vs 10.2 ± 2.4 respectively, T2D 13.8 ± 2.9 vs 13.0 ± 2.7 mmol/L, respectively). As expected, glucose peaks were different according to glycemic status (between subjects, p<0.001, Figure 1E).
After separate group analysis, longer time delays for glucose peakwere observed after OGTT than after breakfast (in subjects with IFG-IGT (85.2 ± 25.5 vs 60.9 ± 19.6 respectively, p=0.003) and with T2D (92.5 ± 24.6 vs 69.3 ± 20.3min respectively, p=0.037), but not in those with NGT (56.3 ± 27.5 vs 53.9 ± 23.1 respectively, p=0.939). The difference between groups according to glycemic status was also significant (between subjects, p<0.001, Figure 1F).
After separate group analyses, the 120 minute AUC was not different after OGTT compared to breakfast (NGT, 811 ± 130 vs 789 ± 108, IFG-IGT, 1044 ± 193 vs 998 ± 234, T2D 1371 ± 286vs 1240 ± 231 mmol*min/L, respectively). The difference between groups according to glycemic status was significant (p<0.001, Figure 1G).
Differences in the 120 minute interstitial glucose after OGTT vsafter breakfast were significant after separate group analyses for all groups: NGT (6.6 ± 1.2 vs 6.0 ± 0.9 mmol/L, p=0.036), IFG-IGT (8.8 ± 1.8 vs7.2 ± 1.9 mmol/L, p<0.001) and T2D (12.4 ± 2.5 vs 10.2 ± 1.9 mmol/L, p=0.034). The 120 minute glucose differed according to glycemic status after OGTT and breakfast (between subjects, p<0.001, interaction OGTT or breakfast*glycemic status, p=0.022, Figure 1H).
Figure 1: Comparison of the kinetics of glucose response after oral glucose tolerance test and a standardised breakfast
A: Mean 120 minute AUC-glucose (inset individual measurements, p=0.075).
B:AUC-glucosecorrelation between breakfast and OGTT (β=0.701, p<0.001).
C: CGM interstitial glucose levels after OGTT in NGT, IFG-IGT, and T2D patients.
D: CGM interstitial glucose levels after breakfast in NGT, IFG-IGT, and T2D patients.
E: Glucose peak levels after OGTT and after breakfast were similar (p=0.154).
F: The time to the glucose peak during OGTT was longer than after breakfast (within subjects, p=0.013) with a significant difference between groups according to glycemic status (p<0.001 for both OGTT and breakfast).
G: The 120-minute AUC-glucose was higher after OGTT than after breakfast (within subjects, p=0.03) with a significant difference according to glycemic status (p<0.001for both OGTT and breakfast).
H: The 2 hour interstitial glucose was higher after OGTT than after breakfast (within subjects, p<0.001) with a significant difference according to glycemic status (p<0.001 for both OGTT and breakfast) and a significant interaction interaction 120 minute glucose* glycemic status, (p=0.022).
OGTT: Two-hour oral glucose tolerance test with 75g of glucose
AUC: Area Under the Curve
Discussion
This study has shown that the AUCs of interstitial glucose after OGTT and after standardised breakfast were highly correlated. After OGTT, interstitial glucoseneeded a longer time to reach its peak, in line with previous studies where glucose was measured in the plasma[3] elicited higher glucose levels at 120 minutes in comparison to breakfast.This profile of response could be explained by the fact that only a part of the carbohydrates included in the breakfast was in liquid form (200 ml of orange juice). There were no differences for the glucose peak and for the 120-minute AUC after OGTT or standardised breakfast.
Interstitial fluid represents a compartment remote from blood and there is a physiological “delay” in glucose measurements between the two compartments. This lag effect is more pronounced during periods of rapid glucose rate of change and may trailvenous glucose levels by 5–10 minutes[16]. The presence of twenty-five time points during the 120-minute period in CGM recordings in this study can provide a better representation of the glucose curve and approximation of the glucose peak time, even in the presence of a physiological “delay.”
In OGTT with five time points, the glucose peak correlated with both insulin sensitivity and insulin secretion[17]. The predictive value of a high glucose peak was previously shown in subjects with NGT who presented a metabolic risk profile similar to IGT. These subjects had an abnormal metabolic profile and, although classified as at low risk, should benefit from an early intervention program[19]. The glycemic status (NGT/IFG-IGT/T2D) did not affect the glucose peak after OGTT or breakfast in the current study, but participants with IFG-IGT and T2D presented lower insulin sensitivity, as expressed with the Matsuda index compared to NGT.
In a recent study, participants without known diabetes had OGTT with five time points and the predicted time to glucose peak was driven mainly by insulin sensitivity[17]. These results were confirmed in another study with a seven time point OGTT,in which a longer delay in glucose peak time was shownin patientswith T2D than in those with NGT,a result associated with a decrease both in insulin sensitivity and secretion[10]. Separate analyses for each group revealed differences for the time to peak after OGTT and breakfastin the patients with hyperglycemia (IFG-IGT and T2D),but not in NGT patients. In a previous work, our group has shown that, in healthy lean subjects,the blood sample collected 45 minutes after a spontaneous lunch meal provided the best estimate for the postprandial plasma glucose peak[18]. The current results forinterstitial glucose peak delay after a meal measured with CGM are approximately in the same range, especially if we take into account the lag in interstitial glucose.
The 120-minute AUC was as expected higher in IFG-IGT and T2D patients. Insulin sensitivity was negatively correlated with the 120-minute AUC after breakfast and after OGTT. The AUC is an important variable for the calculation of insulin sensitivity from OGTT during longer intervals (0–240 min) and can provide a simpler way compared to the use of glucose clamp[20].
Among all the parameters studied from the glucose response to OGGT and breakfast, the 120 minute interstitial glucose value presented the most marked difference according to glycemic status after OGTT and breakfast.Our study was not designed to use the 120-minute glucose for diagnostic purposes, but the decrease in cost and the widespread use of CGM could make diagnostic use an option in the future. Once validated, this approach could provide a practical and easily acceptable method for the diagnosis of hyperglycemia.
The present study has some limitations: the study’s sample size was relatively small, results came from overweight or obese patients that were at high risk of developing diabetes and should be validated in the general population with lower body mass index, and resultswere not validated with intravenous glucose values. Although gastric emptying is more reproducible for solids than for liquids[21], reproducibility of thestandardized breakfast was not tested.
We analyzed the period of 120 min after glucose or breakfast intake in order to compare with usual OGTT practice. A strong point of this study was the use of standardized conditions for physical activity and caloric intake, two factors that can greatly influence glucose levels. Participants had no known hyperglycemia, no treatment for diabetes and were included in a prospective way with a blinded CGM. Finally, the number of time points, although not validated by iv glucose measurements, can allow a better approximation of the glucose peak and the time to glucose peak.
Conclusion
In conclusion, the use of CGM for the study of glucose response curve after a standardized breakfast can provide valuable information on glucose kinetics, comparable to an OGTT, closer to real life conditions. Further studies validating reproducibility and adjusting for interstitial glucose time lag are needed. These variables could also place CGM as a diagnostic tool in glucose metabolism and redefine the study of metabolic abnormalities in everyday life.
Author Disclosure Statement: All authors declare no potential conflict of interest relevant to this article.
Funding: This research was made possible thanks to the kind provision of GCM devices by Medtronic.
Author contributions: M.F. wrote the manuscript, researched data, and performed the statistical analyses; E.C. contributed to discussion and reviewed/edited the manuscript; A.R. recruited patients, performed CGM recordings and contributed to discussion; P.V. directed research, designed the study, recruited patients, contributed to discussion, reviewed and edited the manuscript.
References
- 1. Jacobsen, A. Studies on the influence of chloral hydrate on experimental forms of hyperglycemia. (1913) Biochem Z 51: 443.
Pubmed | Crossref | Others
- 2. Classification and Diagnosis of Diabetes. (2015) Diabetes Care 38(Supplement 1): S8-S16.
- 3. Wolever, T.M., Chiasson, J.L., Csima, A., et al. Variation of postprandial plasma glucose, palatability, and symptoms associated with a standardized mixed test meal versus 75 g oral glucose. (1998) Diabetes Care 21(3): 336-340.
- 4. Olefsky, J.M., Reaven, G.M. Insulin and glucose responses to identical oral glucose tolerance tests performed forty-eight hours apart. (1974) Diabetes 23(5): 449-453.
- 5. Mooy, J.M., Grootenhuis, P.A., de Vries, H., et al. Intra-individual variation of glucose, specific insulin and proinsulin concentrations measured by two oral glucose tolerance tests in a general Caucasian population: the Hoorn Study. (1996) Diabetologia 39(3): 298-305.
- 6. Meier, J.J., Baller, B., Menge, B.A., et al. Excess glycaemic excursions after an oral glucose tolerance test compared with a mixed meal challenge and self-measured home glucose profiles: is the OGTT a valid predictor of postprandial hyperglycaemia and vice versa? (2009) Diabetes Obes Metab 11(3): 213-222.
- 7. Seifarth, C., Bergmann, J., Holst, J.J., et al. Prolonged and enhanced secretion of glucagon-like peptide 1 (7-36 amide) after oral sucrose due to alpha-glucosidase inhibition (acarbose) in Type 2 diabetic patients. (1998) Diabet Med 15(6): 485-491.
- 8. Aloulou, I., J.F. Brun, Mercier, J. Evaluation of insulin sensitivity and glucose effectiveness during a standardized breakfast test: comparison with the minimal model analysis of an intravenous glucose tolerance test. (2006) Metabolism 55(5): 676-690.
- 9. Frape, D.L., Williams, N.R., Scriven, A.J., et al., Diurnal trends in responses of blood plasma concentrations of glucose, insulin, and C-peptide following high- and low-fat meals and their relation to fat metabolism in healthy middle-aged volunteers. (1997) Br J Nutr 77(4): 523-35.
- 10. Wang, X., Zhao, X., Zhou, R., et al. Delay in glucose peak time during the oral glucose tolerance test as an indicator of insulin resistance and insulin secretion in type 2 diabetes patients. (2018) J Diabetes Investig 9(6):1288-1295.
- 11. Benkhadra, K., Alahdab, F., Tamhane, S., et al., Real-time continuous glucose monitoring in type 1 diabetes: a systematic review and individual patient data meta-analysis. (2017) Clin Endocrinol (Oxf) 86(3): 354-360.
- 12. Danne, T., Nimri, R., Battelino, T., et al. International Consensus on Use of Continuous Glucose Monitoring. (2017) Diabetes Care 40(12): 1631-1640.
- 13. Bailey, T.S. Clinical Implications of Accuracy Measurements of Continuous Glucose Sensors. (2017) Diabetes Technol Ther 19(S2): S51-S54.
- 14. Fysekidis, M., Cosson, E., Banu, I., et al. Increased glycemic variability and decrease of the postprandial glucose contribution to HbA1c in obese subjects across the glycemic continuum from normal glycemia to first time diagnosed diabetes. (2014) Metabolism 63(12): 1553-1561.
- 15. American Diabetes Association. Diagnosis and classification of diabetes mellitus. (2011) Diabetes Care 34(Suppl 1): S62–S69.
- 16. Cengiz, E., Tamborlane, W.V. A tale of two compartments: interstitial versus blood glucose monitoring. (2009) Diabetes Technol Ther 11 Suppl 1: S11-16.
- 17. Hulman, A., Witte, D.R., Vistisen D., et al. Pathophysiological Characteristics Underlying Different Glucose Response Curves: A Latent Class Trajectory Analysis From the Prospective EGIR-RISC Study. (2018) Diabetes Care 41(8): 1740-1748.
- 18. Chapelot, D., Marmonier, C., Valensi, P. Predicting more accurately the overall glucose response to a lunch meal by using the postprandial glucose peak. (2007) Metabolism 56(1): 37-43.
- 19. Manco, M., Panunzi, S., Macfarlane, D.P., et al. One-hour plasma glucose identifies insulin resistance and beta-cell dysfunction in individuals with normal glucose tolerance: cross-sectional data from the Relationship between Insulin Sensitivity and Cardiovascular Risk (RISC) study. (2010) Diabetes Care 33(9): 2090-2097.
- 20. Caumo, A., Bergman, R.N., Cobelli, C. Insulin sensitivity from meal tolerance tests in normal subjects: a minimal model index. (2000) J Clin Endocrinol Metab 85(11): 4396-4402.
- 21. Collins, P.J., Horowitz, M., Cook, D.J., et al. Gastric emptying in normal subjects--a reproducible technique using a single scintillation camera and computer system. (1983) Gut 24(12): 1117-1125.


