Experimental analysis of carbon nanotubes in cementitious materials
Jorge Morais
Affiliation
Engineer and PhD Associate Professor at Universidade Federal Fluminense in Rio de Janeiro, Brazil
Engineer and PhD Titular Professor at Universidade Federal do Rio de Janeiro in Rio de Janeiro, Brazil
Corresponding Author
de Morais, J.F, Engineer and PhD Associate Professor at Universidade Federal Fluminense in Rio de Janeiro, Brazil, E-mail: jmorais@yahoo.com
Citation
de Morais, J.F., et al. Experimental Analysis of Carbon Nanotubes in Cementitious Materials Composites. (2017) J Nanotechnol Material Sci 4(2): 99- 111.
Copy rights
© 2017 de Morais, J.F. This is an Open access article distributed under the terms of Creative Commons Attribution 4.0 International License
Keywords
Nanocomposites; Cementitious materials; Carbon nanotubes; Compressive strength; Tensile strength.
Introduction
The construction industry is a branch of the engineering of great importance to society, ranked among the forty industrial sectors that are likely to be affected by nanotechnology in the near future. Concrete and its related products were considered basics inputs for this industry[1].
Understanding the behavior at the nanoscale of the cement matrix and its interaction with other components in the built environment can provide a powerful approach to the development of superior concrete with better properties and more effective control of the degradation process. Concrete requires excellent filling capacity and adequate resistance to segregation. In general, conventional research on concrete consider the addition of active substances to improve their mechanical properties such as ash, ground granulated blast-furnace slag, limestone, etc[3].
Some experiments with nano materials have already allowed the development of high performance cement compounds with low cost, which can lead to an intensive use of these materials in civil engineering in general[1]. The concrete properties in its initial state, as fluidity and workability, are governed by the distribution and size of the particles, while the concrete properties in the hardened state, such as strength and durability, are affected both by the granulation of the particles, but also for its arrangement or grouping in the aggregate[4].
One of the most desirable properties of nanomaterials used in the construction industry is their ability to confer mechanical reinforcement to the structure of the materials. Due to the remarkable properties of carbon nanotubes, the insertion of this material into cement compounds can achieve this goal, resulting in a new class of cement products that will boost the construction industry[5].
The nanotubes act to modify the molecular structure of the cementitious materials, which leads to improve its physical properties. The nanotubes directly influence in the mechanical performance, volumetric stability, durability and sustainability of the structure[6].
Nowadays, carbon nanotubes have also been used to reinforce many kinds of materials including metals[7]. Studies have shown that pressure above 500 MPa can be transferred across the interface between a polymer and the carbon nanotube, this strength is 10 times larger than at between polymer with carbon fiber[8].
Makar et al.[9] were the first to indicate by hardness measurements, that carbon nanotubes can affect the cement hydration in its initial state, and that a strong bond is possible between cement paste and carbon nanotubes. They report that the nanotubes have a special role in controlling cracking of the composite, as by its size and proportions inserted into the matrix, they are distributed in a better way than the fibers, commonly used as reinforcement. Agullo et al.[10] observed an increase in early age compressive strengths by adding low concentration of Multiwall Carbon Nanotubes (MWNT) within cement composite.
Balaguru and Chong[11] believe that the development of nanoscience in concrete is needed, since properties such as low shrinkage, resistance to high and low temperatures, compatibility with different types of fibers and responsiveness with nanomaterials, such as carbon nanotubes can be used to create new products with good performance. Carbon nanotubes and carbon nano fibers appear to be among the most promising nanomaterials to improve the mechanical properties of cementitious materials, and their resistance to crack propagation and other abnormalities[12].
Hunashyal et al.[13] obtained higher tensile strength and better stress-strain relationship in direct tension for cement samples with carbon nanotubes. Han et al.[14] showed that the addition of MWNT could decrease water absorption and the permeability coefficient of carbon nanotubes in reinforced cement- based materials. Manzur et al.[15] found that MWNT with OD (outside diameter) 20 nm or less obtained higher compressive strengths as compared to larger OD-MWNT, when used in mortar and the maximum compressive strength was achieved by the smallest size of MWNT considered in the study.
Lelusz[16] found that compressive strength of cement composites decreased with the increase in CNT dosage. This research used different dosage rates of MWNT ranging from 0.00% to 0.12% by weight of cement. A suitable mix proportion was proposed by Manzur et al.[17] in another study to produce surface treated MWNT reinforced cement composites based on flexural and compressive strengths. It is, therefore, quite evident that carbon nanotubes reinforcement could result in robust and improved cementitious composites.
Campillo et al.[18] tested a cementitious compound with carbon nanotubes under compression and found that carbon nanotubes types SWCNT, and MWCNT increased the compression resistance in relation to the pure cement in 6% and 30%, respectively. Lai and Bassem[19] conducted experiments to investigate the effectiveness of the carbon nanotubes, uniformly dispersed and randomly oriented, used as reinforcement of cementitious composites.
Results of the work of Shah et al.[20] demonstrated that nanomodification of cementitious materials can lead to significant improvement of the mechanical property, compactness, and durability. With the recent advances in instrumentation and design of advanced nanocomposite materials, new technological directions and historical milestones in nanoengineering and nanomodification of cement based materials are obtainded. There is a strong potential of nanotechnology to improve the performance of cement-based materials[5].
Experimental Investigation
To achieve the objective of this research, was perform experimental program at the laboratories of the Universitat Politecnica de Catalunya (UPC) - Barcelona- Spain, through destructive testing with cementitious samples with and without carbon nanotubes[21].
The main tests were carried out with mortar samples (cylindrical - 4.4 cm x 8.0 cm) with carbon nanotube content of 0.00%, 020%, 0.40% and 0.60% by the cement weight and at the ages of 3 days, 7 days and 28 days, using a replication factor of 3 for each blend. The specimens for testing were prepared using mixes with different percentages of carbon nanotubes. Four different blends were used to evaluate the behavior of mortars with and without nanotubes: mix 1 (CN0): cement + sand + water + 1,0% additive; mix 2 (CN2): cement + sand + water + 1,0% additive + 0.20% CNT; mix 3 (CN4): cement + sand + water + 1,0% additive + 0.40% CNT; mix 4 (CN6): cement + sand + water + 1,0% additive + 0.60% CNT. The destructive tests were performed to evaluate compression resistance and tensile strength of the cylindrical samples of 4.4 cm x 8.0 cm, in order to compare the behavior of mixtures with NTC, with the reference mortar (CN0), without nanotubos.
The ability to withstand compression forces and tension is an important indicator when evaluating the mechanical strength of cementitious materials. Although the performance of these materials depends on several other factors, it provides a good indication of product quality. Low values of resistance indicate that the mortar or concrete has problems in its structure, that may come from the use of the unsuitable materials till a bad formation of its internal structure, due to lack of densification or absence of proper healing, for example.
Materials and Methods
The study was oriented to essentially obtain comparative results between mortar samples with and without carbon nanotubes with no concern with maximization or process improvement. Therefore, it was used in the experiment commercial materials frequently applied in construction, always maintaining the relationship between the components in the preparation of the mortar mixtures and following the same methodology for samples manufacturing and testing: cement Portland CEM I 52, 5 R UNC-EM 197-1, manufactured by Cimento Molins Industrial S.A. from Barcelona, Spain; Sand fine provided by Arids Catalunya S.A from Barcelona, Spain; Potable water supplied by Water and Sanitation Company of Barcelona, Spain; Additive super plasticizer polycarboxylate ADVA Flow 401 produced by GRACE Construction Products according to European Standard EN934-2; Carbon Nanotubes produced and supplied by the Nanomaterials Laboratory of Physics Department of Universidade Federal de Minas Gerais (UFMG) Brazil. They were produced by the method of chemical deposition in vapor phase identified by MWCNT HP2627 and have the following characteristics: type, multiwalled carbon nanotubes (MWCNT), weight, 60 g, purity, > 93%, other carbon structures, < 2%, contaminants, < 5% of catalyst powder type MgOCo-Fe, and dimensions, 99% of the CNT external diameter between 5 nm and 60 nm and a length estimated from 5 μm e 30 μm.
Specimens
The preparation of the samples for testing followed the European standard EN 196-1 (2005), which establishes the standard composition of the components for manufacturing mortar in the following proportions: cement / sand, 1: 3, cement / water 1: 1/2. The mixtures were prepared for the manufacture of samples using this relation and adding CNT and additive. As it was done with sand and water, the additive and the percentage of carbon nanotubes in the mixture were taken, based on the weight of cement.
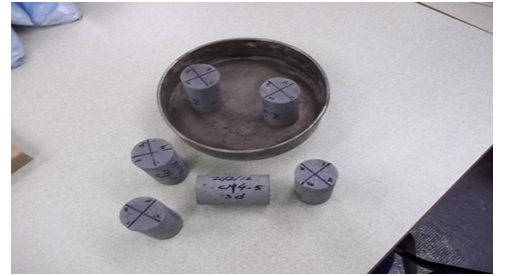
The specimens had to be manufactured in batches of six due to the small capacity of the mixer for preparation of mortars, associated to the plan of the test in the ages of 3, 7 and 28 days and the shared use of the laboratory of the UPC. The production of mortar and molding of the specimens were performed on the materials laboratory of the “Escola Politecnica Superior d’ Edificacio of UPC”, following the methodology outlined below. Initially cement and sand were weighed on a precision balance Gram brand, model ST-4000, maximum capacity of 4,000 g, and accuracy of 0.1 g. Then the two materials were mixed manually until they reached a homogeneous appearance; then, water and additive were weighed on the same balance; the additive and water were mixed manually in a plastic container for about 5 minutes; next the nanotube was weighed on the same balance, for the blends that include this material; the nanotube was added to water with the additive and mixed by hand for 5 minutes; 3 then this whole was submitted to the sonication for 60 minutes to obtain a dispersion of nanotubes and a better homogenization of the mixture. For this purpose, we used the equipment ultrasonic P2000 clining qteck Gmbh; the cement and sand (previously mixed) were accommodated within the mixer, brand Matest model E93, with maximum capacity of 3 kg together with the mixture of the water, additive and CNT; after a mixing time of 15 minutes, the mortar was removed from the mixer for molding the samples. The densification of the samples was made in two layers, using a manual vibrating platform. The surface finish of the samples was performed with the aid of a spatula; after molding, the specimens were kept for 24 hours in a chamber at a temperature of 21.4°C and 99% relative humidity; after 24 hours, the specimens were demoulded and then were returned to the greenhouse, where they were kept until the test date. Figure 1 shows a batch of six samples ready for testing.
Figure 1: Samples used in the testing.
Items of investigation
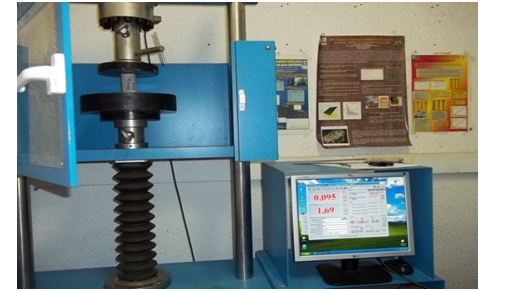
Tests of Compressive and Tensile strength by diametric compression were performed at the Laboratory of the Department of Materials Science and Metallurgical Engineering, University of Barcelona (UB), at the ages of 3, 7 and 28 days after manufacturing the test pieces, in accordance with standard UNE-EN 196-1 (2005). It was used in this test, a hydraulic-digital press, INCOTECNIC brand, model PA/MPC-2, with capacity of 20 tons (44.092, 45 lb), as shown in Figure 2.
Figure 2: Press used for compression and tensile strength tests.
Source: Department of Materials Science and Metallurgical Engineering, UB.
For each blend and age, were used in the test, 3 samples (replication factor). The reading provided by the press at the time of rupture of the sample corresponds to the compressive /tensile strength measured in kilo Nilton (KN). The compressive stress and tensile stress, in mega Pascal (MPa) was obtained respectively with the application of the formulas 1 and 2:
σc(MPa) = (Fc (KN) / S (mm222 ))*1000 (1)
σt(MPa) = 2000*Ft (KN) / π d (mm) L(mm) (2)
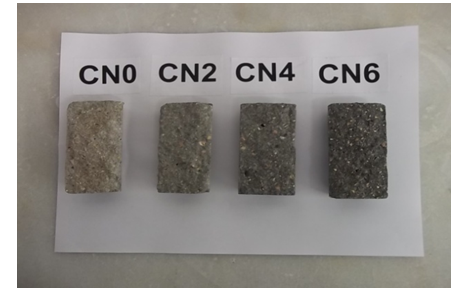
With the disruption of the samples, it was noted that the coloring of the mixtures was different, varying depending on the content of carbon nanotubes (NTC). Figure 3 shows a darker coloration of all samples with NTC, compared to the reference sample.
Figure 3: Color of mixtures used in the experiment.
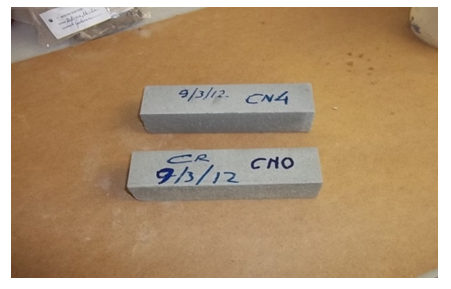
Additional tests were made to obtain the flexure curves of the samples. This test was performed for reasons of feasibility and objectiveness in prismatic specimens of dimensions 4.0 x 4.0 x 16 cm (1.57 in x 1.57 in x 6.30 in), Figure 4, and only traces CN0 and CN4, at the age of 28 days.
Figure 4: Samples used for the bending test.
10 The specimens were positioned in the press, supported at two points on the surface opposite to the application of force, so that the load was applied at the center of the body, as described by the Standard NP EN 1992-1-1. Were performed porosity tests also, to evaluate the microstructure of the materials.
Results and Discussion
The following we outline the results of tests with mortar samples, with and without carbon nanotubes. For best results, we performed the work using the methodology of “Design of Experiments (DOE)[24], and getting graphs and curves with the Excel Program resources.
Compressive strength
The following are shown the test results as well as the corresponding graphics, carried out with mortar samples with and without carbon nanotubes where each sample is identified by its composition and age. For example, 3CN2 means a sample with 0.20% of CNT at 3 days of age. Table 1 lists, the maximum and average values reached by the rupture of the samples in the compression test. Note that for each mixture and age were disrupted randomly three samples in accordance with the defined replication factor.
Table 1: Maximum and mean values and gain for the Compressive Strength.
| COMPRESSION TEST | ||||||||||
| AGE | Sample # | Maximum Strength(KN) | Maximum Tension (Mpa) | |||||||
|---|---|---|---|---|---|---|---|---|---|---|
| CN0 | CN2 | CN4 | CN6 | CN0 | CN2 | CN4 | CN6 | |||
| 3 days | 1 | 34,01 | 36,71 | 35,90 | 22,23 | 23,57 | 23,46 | |||
| 2 | 33,31 | 22,11 | ||||||||
| 3 | 38,92 | 26,15 | ||||||||
| 4 | 40,90 | 44,61 | 26,75 | 29,27 | ||||||
| 5 | 45,80 | 36,15 | 29,49 | 23,68 | ||||||
| 6 | 29,41 | 45,91 | 34,98 | 19,04 | 30,71 | 22,41 | ||||
| Average | 34,77 | 36,31 | 45,44 | 35,57 | 22,67 | 23,94 | 29,82 | 23,18 | ||
| % Gain / (Loss) | 0,00 | 4,00 | 30,67 | 2,30 | 0,00 | 5,60 | 31,53 | 2,25 | ||
| 7 days | 1 | 39,95 | 55,83 | 26,60 | 35,58 | |||||
| 2 | 38,50 | 59,25 | 24,87 | 38,39 | ||||||
| 3 | 42,28 | 57,81 | 27,35 | 37,59 | ||||||
| 4 | 47,18 | 38,05 | 30,65 | 24,83 | ||||||
| 5 | 40,26 | 42,41 | 26,18 | 27,54 | ||||||
| 6 | 40,37 | 38,57 | 26,06 | 24,26 | ||||||
| Average | 39,95 | 42,60 | 57,63 | 39,68 | 26,27 | 27,63 | 37,19 | 25,54 | ||
| % Gain / (Loss) | 0,00 | 6,64 | 44,26 | -0,67 | 0,00 | 5,16 | 41,54 | -2,77 | ||
| 28 days | 1 | 44,23 | 29,10 | |||||||
| 2 | 45,67 | 61,41 | 30,04 | 40,39 | ||||||
| 3 | 48,10 | 44,53 | 39,56 | 31,61 | 28,54 | 25,81 | ||||
| 4 | 59,05 | 41,54 | 38,77 | 27,36 | ||||||
| 5 | 49,65 | 62,32 | 41,36 | 32,45 | 40,54 | 27,05 | ||||
| 6 | 48,80 | 31,81 | ||||||||
| Average | 46,00 | 49,23 | 61,41 | 40,82 | 30,25 | 30,93 | 39,90 | 26,74 | ||
| % Gain / (Loss) | 0,00 | 7,02 | 33,50 | -11,26 | 0,00 | 2,24 | 31,90 | -8,29 | ||
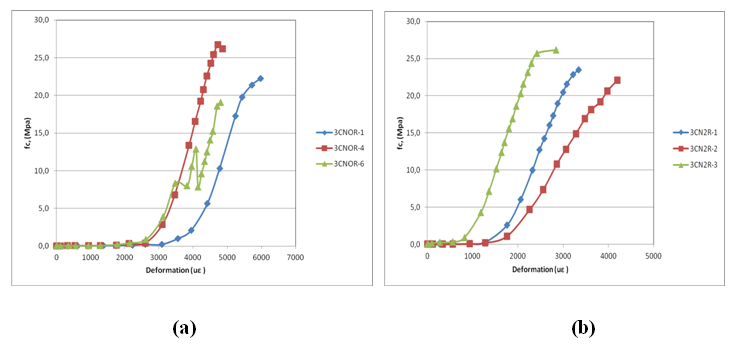
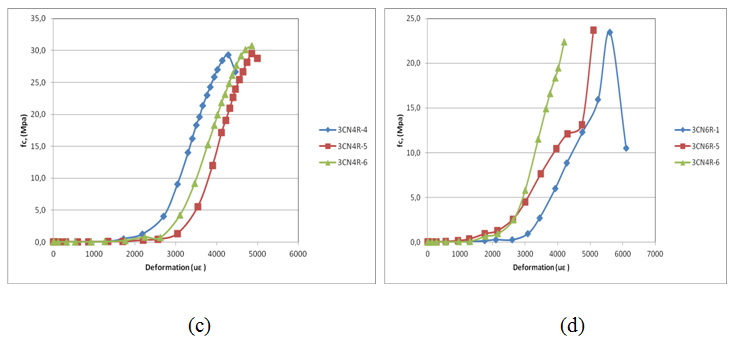
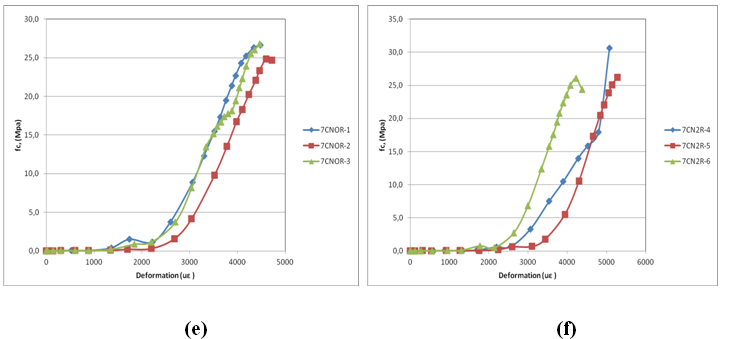
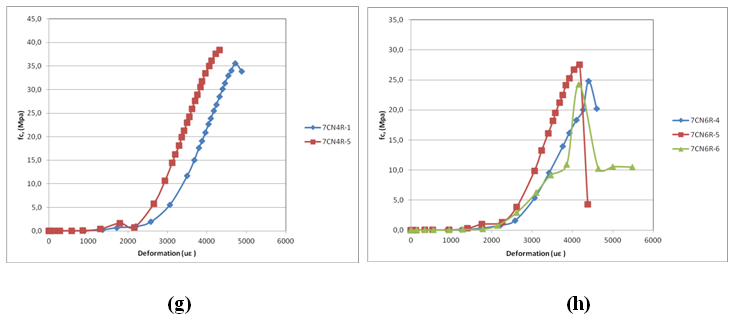
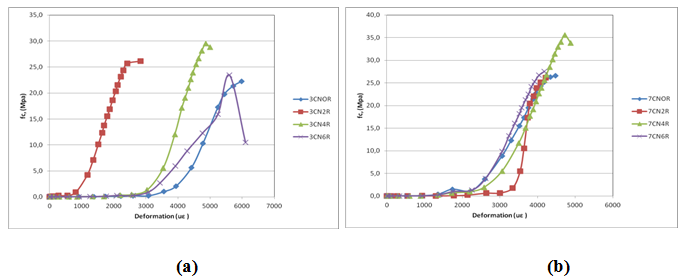
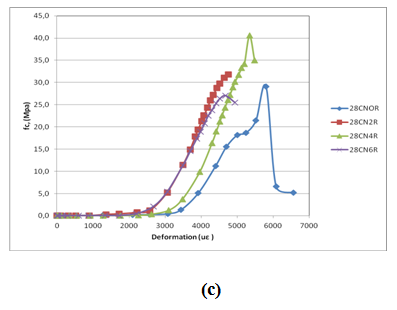
In the figure 5 below, the graphs show the curves of the force vs. deformation of the samples, delineating the sequence of values obtained with the press during the compression test.
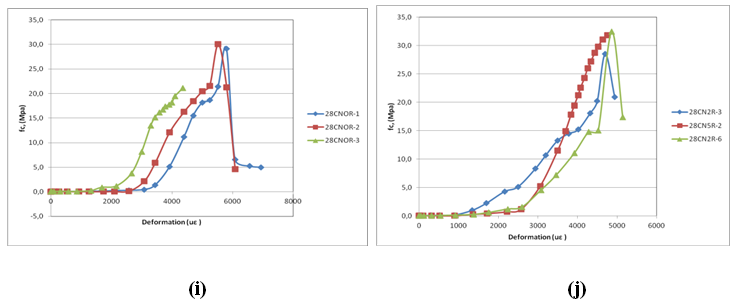
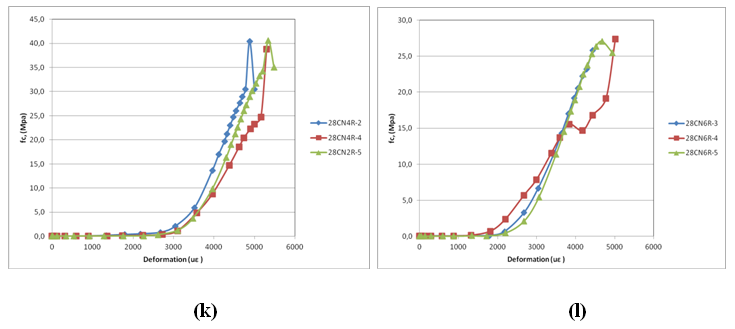
Figures (5a) to (5d) show the behavior of different samples and mixtures, at the age of 3 days. In figure 5 (a) it is observed that the sample set as CN0R6 showed an irregular behavior, reaching a limit fc below expectations. This may be due to an error in the reading process or the poor quality of the specimen, which occurred during its manufacture. All samples containing 0.40% carbon nanotubes have achieved higher peak values of fc, at 3 days of age when compared to other blends in the same age, as can be seen in Figure 5 (c).
Figures (5e) to (5h) show the behavior of different samples and blends, at the age of 7 days. Again, we can see in figure 5 (g) that the largest peak values of fc, at 7 days of age correspond to the blend with 0.40% of carbon nanotubes. In this figure, only the results of the two samples are reported, because of the data recording, corresponding to the third sample was lost during the tests. Figures 5 (f) and 5 (h) show that addition of 0.20% and 0.60% carbon nanotubes in the cementitious mixtures, at 7 days of age, did not introduce significant improvements in compressive strength, compared to reference blend, CN0.
Figures (5i) to (5l) show the behavior of different samples and blends, at the age of 28 days. In figure 5 (k) we can see that the largest peak values of fc, at 28 days of age correspond to the blend with 0.40% of carbon nanotubes. Figure 5 (i), shows that sample # 1 of the mixture without carbon nanotubes (CN0) also presented, possibly, manufacturing problem.
Figure 5: Graphs with the curves of the various samples with different blends and ages.
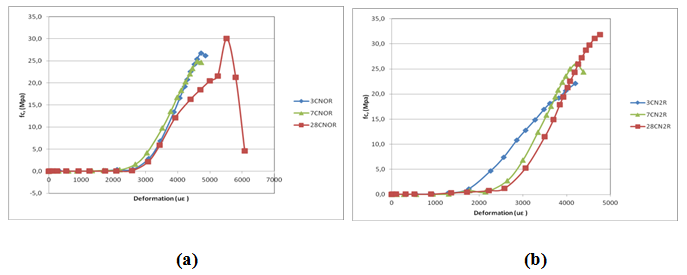
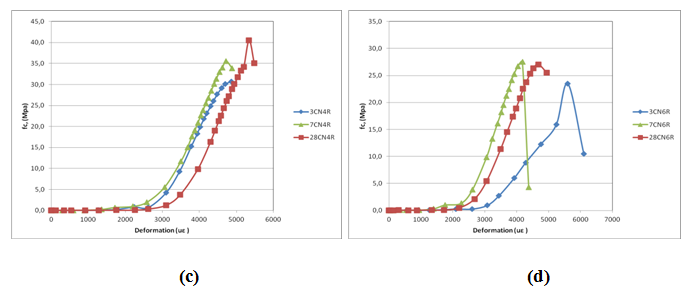
Getting to better understand of the compressive resistance variation of each mixture at the ages of 3 days, 7 days and 28 days, we plotted in Figure 6 the curves representing the fc average values registered by the press, with breakage of the three samples used in each trial.
In Figure 6 (c), we see that the mixture with addition of 0.40% of carbon nanotubes had a significant increase in compressive strength at all ages, when compared with the reference mixture (CN0), reaching the highest gain at 28 days of age.
Figure 6: Compressive strength variation curves, for each blend, with age. (a) CN0; (b) CN2; (c) CN4 e (d) CN6
Conversely to the previous figure, the figure 7 gathers, by age, the curves of the 4 blends used in the test.
Figure 7: Compressive strength variation curves with age. at 3 days; (b) at 7 days and (c) at 28 days
It can be seen that the composite with 0.40% nanotubes had the best performance at all ages, with a substantial increase of compressive strength in comparison with the reference sample CN0, reaching the highest gain, about 42%, at 7 days old. The insertion of carbon nanotubes in the composites CN2 and CN6 did not affect significantly the result of the compressive strength being still observed that the blends CN6 had their values reduced, at the age of 28 days. The fact that the sample CN4 have had better performance may indicate that there is a range considered “optimal” to the insertion of nanotubes into arrays of cement, and this band should be close to the values quoted. It was still noticed that, out of that band, there is no significant gain, and can occur even loss of resistance. The increase obtained in the compressive strength is also related to the dispersion of carbon nanotubes in the array. When the dispersion is well performed the nanotubes are diluted in the cement paste homogenously by making interconnections with the calcium silicate, hydrated and with the grains of the mixture, with no occurrence of punctual agglomeration. This leads to a denser matrix, which contributes to obtain a new material tougher.
Tensile strength
Table 2 summarizes the maximum and average values, as well as the relative gain reached by the samples in the evaluating of its tensile strength by diametric compression. Note that for each mixture and age were disrupted randomly three samples in accordance with the defined replication factor.
Table 2: Maximum and mean values and gain for the tensile strength (1 kN = 224, 81 lbf).
| TENSILE TEST BY DIAMETRAL COMPRESSION | ||||||||||
|---|---|---|---|---|---|---|---|---|---|---|
| AGE | Sample # | Maximum Strength(KN) | Maximum Tension (Mpa) | |||||||
| CN0 | CN2 | CN4 | CN6 | CN0 | CN2 | CN4 | CN6 | |||
| 3 days | 1 | 18,63 | 3,18 | |||||||
| 2 | 16,09 | 18,62 | 16,70 | 2,85 | 3,22 | 2,88 | ||||
| 3 | 13,14 | 19,19 | 15,18 | 2,32 | 3,38 | 2,64 | ||||
| 4 | 15,78 | 15,09 | 2,80 | 2,63 | ||||||
| 5 | 20,19 | 15,04 | 3,53 | 2,69 | ||||||
| 6 | 17,48 | 3,05 | ||||||||
| Average | 16,47 | 16,10 | 18,81 | 15,94 | 2,90 | 2,85 | 3,26 | 2,72 | ||
| % Gain / (Loss) | 0,00 | -2,25 | 14,21 | -3,21 | 0,00 | -1,80 | 12,41 | -6,20 | ||
| 7 days | 1 | 17,75 | 18,16 | 3,13 | 3,17 | |||||
| 2 | 18,68 | 15,32 | 3,22 | 2,70 | ||||||
| 3 | 16,03 | 17,96 | 2,82 | 3,09 | ||||||
| 4 | 15,01 | 19,44 | 2,69 | 3,34 | ||||||
| 5 | 16,01 | 20,84 | 2,74 | 3,61 | ||||||
| 6 | 18,50 | 24,16 | 3,25 | 4,13 | ||||||
| Average | 16,51 | 17,49 | 21,48 | 16,74 | 2,89 | 3,06 | 3,69 | 2,99 | ||
| % Gain / (Loss) | 0,00 | 9,22 | 30,10 | 1,39 | 0,00 | 5,65 | 27,68 | 3,46 | ||
| 28 days | 1 | 19,68 | 24,67 | 17,47 | 3,45 | 4,34 | 3,06 | |||
| 2 | 20,46 | 18,52 | 3,63 | 3,18 | ||||||
| 3 | 23,24 | 4,12 | ||||||||
| 4 | 17,48 | 21,20 | 2,98 | 3,72 | ||||||
| 5 | 19,51 | 3,34 | ||||||||
| 6 | 18,36 | 23,16 | 20,80 | 3,26 | 4,08 | 3,58 | ||||
| Average | 18,45 | 20,45 | 23,69 | 18,93 | 3,19 | 3,60 | 4,18 | 3,27 | ||
| % Gain / (Loss) | 0,00 | 10,84 | 28,40 | 2,60 | 0,00 | 12,85 | 31,03 | 2,51 | ||
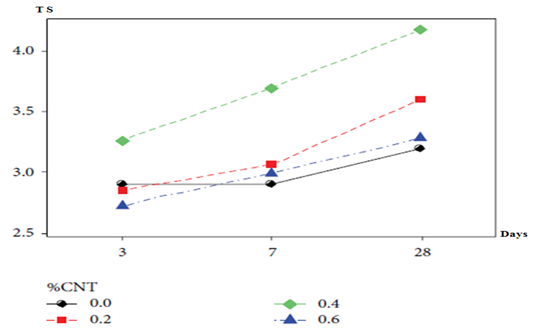
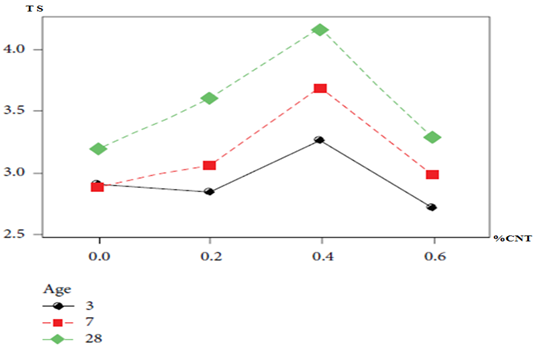
Figures 8 and 9 show graphically the variation of the average value of the tensile strength by diametrical compression with the age and the percentage of carbon nanotubes of the samples of mortar, respectively.
Figure 8: Average variation of the tensile strength.
Figure 9: Average variation of the tensile strength.
It can be observed that the composite with 0.4% of nanotubes had the best performance at all ages with substantial increase of tensile strength, compared to reference sample CN0. The tensile strength reached its peak, with an increase of approximately 31% at age 28 days.
However, it is noteworthy that all samples with carbon nanotubes had increases in the tensile strength at ages 7 days and 28 days. The CN2 sample reached a gain of 12.85%, at the age of 28 days in relation on the reference sample CN0. This result corroborates with the good performance of the nanotubes in improving the tensile strength, acting in a significant way on the weak point of the concrete, which is its tensile strength.
Again, the fact that the sample CN4 have had better performance may indicate that there is a range considered “optimal” to the insertion of nanotubes into arrays of cement, and this band should be close to the values quoted. The graphs in Figure 8 also provide a more general statistical view of what goes on with the experiment, due to the interference of the variables in the process. In it can be seen the variation of the average values of tensile strength, with the combination of each level of a variable, with of the levels of the other variable. The tensile test depicts an interaction between the curves CN0, CN2 and CN6 in the ages between days and 7 days, when the average tensile strength of the mixture reaches a level of around 2.90 MPa. Graphics of the Figure 10 show the evolution of the average value of the tensile strength of the samples with the percentage of carbon nanotubes and with the age.
It is noted that, the average value of the tensile strength, is around 2.93 MPa, at the age of 3 days increasing for 3.15 MPa at 7 days and reaching 3.56 MPa at 28 days of age. From the point of view of the variable, percentage of nanotubes, the average of the tensile strength is 3.0 MPa for CN0, passing to 3.17 MPa for CN2, peaking 3.71 MPa for the CN4 mixing, and falling to 3.0 MPa with the CN6 composite. As can be seen in Figure 10 the best results were achieved for mixing with 0.40% of nanotubes and at 28 days of age.
Figure 10: Evolution of the average of the tensile strengths.
Resistance to the Bending Stresses
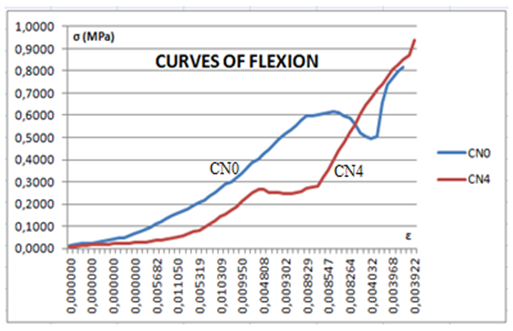
The tests for obtaining the flexure curves of the mixtures were performed on prismatic samples of dimensions 4.0 x 4.0 x 16 cm (1.57 in x 1.57 in x 6.30 in) (Figure 4) and for reasons of objectivity, only with the blends CN0 and CN4 and, at the age of 28 days. The test results reported are shown in Table 3 and the corresponding curves of flexion, in the form of load versus deformation are displayed in figure 11.
The bending curves of figure 11 show that the CN4 compound resulted in a better performance compared to CN0 mixture. From Table 3, we see that the break point of the sample CN4 was of 2.99 kN, about 15% higher than the rupture load supported by the blend without nanotubes (2,6145 kN). This result corroborates with an important characteristic of the carbon nanotubes which is its high resistance to bending, resulting in a significant improvement in the well known weakness of concrete. The table 3, also shows that from the beginning of application of the load to point of rupture, the sample CN4, withstood a deformation of 0.90 mm (0, 0354 in), whereas with the sample CN0, the deformation was 0.81 mm (0, 0319 in), indicating that the insertion of nanotube became the composite more malleable, i.e., with greater deformation capacity and so, can withstand more loading.
Table 3: Results of flexural test (1N = 0,224 808 943 lbf, 1 mm = 0, 0393701 in).
| MEASURES OF THE FLEXURAL TEST | |||||||||||
|---|---|---|---|---|---|---|---|---|---|---|---|
| CN0 | CN0 | CN0 | CN4 | CN4 | CN4 | ||||||
| Strength | Def. | Strength | Def. | Strength | Def. | Strength | Def. | Strength | Def. | Strength | Def. |
| 0,0440 | 2,83 | 0,5405 | 3,06 | 1,7723 | 3,33 | 0,0314 | 1,66 | 0,1885 | 1,84 | 0,8107 | 2,22 |
| 0,0566 | 2,84 | 0,5719 | 3,07 | 1,8477 | 3,34 | 0,0314 | 1,66 | 0,2137 | 1,86 | 0,8233 | 2,24 |
| 0,0691 | 2,85 | 0,6159 | 3,08 | 1,9043 | 3,35 | 0,0377 | 1,66 | 0,2388 | 1,88 | 0,8610 | 2,26 |
| 0,0754 | 2,85 | 0,6662 | 3,10 | 1,9169 | 3,36 | 0,0440 | 1,67 | 0,2640 | 1,89 | 0,8862 | 2,29 |
| 0,0754 | 2,86 | 0,6976 | 3,11 | 1,9294 | 3,37 | 0,0503 | 1,67 | 0,3080 | 1,91 | 0,9050 | 2,31 |
| 0,0880 | 2,87 | 0,7542 | 3,13 | 1,9483 | 3,38 | 0,0503 | 1,67 | 0,3582 | 1,93 | 1,0307 | 2,34 |
| 0,1006 | 2,88 | 0,7982 | 3,14 | 1,9609 | 3,40 | 0,0628 | 1,68 | 0,3959 | 1,94 | 1,1375 | 2,36 |
| 0,1194 | 2,89 | 0,8673 | 3,16 | 1,9671 | 3,41 | 0,0628 | 1,69 | 0,4588 | 1,96 | 1,2758 | 2,38 |
| 0,1320 | 2,90 | 0,9239 | 3,17 | 1,9609 | 3,42 | 0,0691 | 1,69 | 0,4902 | 1,98 | 1,4141 | 2,40 |
| 0,1445 | 2,91 | 0,9679 | 3,18 | 1,9169 | 3,44 | 0,0691 | 1,70 | 0,5531 | 1,99 | 1,5209 | 2,42 |
| 0,1571 | 2,92 | 1,0307 | 3,20 | 1,8729 | 3,45 | 0,0754 | 1,71 | 0,6033 | 2,01 | 1,6780 | 2,44 |
| 0,1823 | 2,93 | 1,0873 | 3,21 | 1,7912 | 3,47 | 0,0754 | 1,72 | 0,6850 | 2,03 | 1,7912 | 2,45 |
| 0,2074 | 2,94 | 1,1627 | 3,22 | 1,6655 | 3,49 | 0,0817 | 1,72 | 0,7416 | 2,04 | 1,9357 | 2,47 |
| 0,2388 | 2,95 | 1,2381 | 3,24 | 1,6089 | 3,51 | 0,0817 | 1,74 | 0,8045 | 2,06 | 2,0740 | 2,48 |
| 0,2828 | 2,97 | 1,2884 | 3,25 | 1,5775 | 3,54 | 0,0943 | 1,75 | 0,8484 | 2,08 | 2,1682 | 2,49 |
| 0,3142 | 2,98 | 1,3701 | 3,26 | 1,6215 | 3,56 | 0,1006 | 1,76 | 0,8547 | 2,09 | 2,2814 | 2,50 |
| 0,3582 | 2,99 | 1,4329 | 3,27 | 2,0928 | 3,58 | 0,1131 | 1,77 | 0,8107 | 2,11 | 2,3631 | 2,51 |
| 0,3897 | 3,00 | 1,5083 | 3,29 | 2,3694 | 3,60 | 0,1257 | 1,78 | 0,8045 | 2,13 | 2,4699 | 2,52 |
| 0,4336 | 3,02 | 1,5838 | 3,30 | 2,4573 | 3,61 | 0,1383 | 1,80 | 0,7982 | 2,15 | 2,5768 | 2,53 |
| 0,4714 | 3,03 | 1,6466 | 3,31 | 2,5453 | 3,63 | 0,1445 | 1,81 | 0,7919 | 2,17 | 2,6396 | 2,54 |
| 0,5028 | 3,04 | 1,7157 | 3,32 | 2,6145 | 3,64 | 0,1697 | 1,83 | 0,7919 | 2,19 | 2,7276 | 2,55 |
| 2,7842 | 2,55 | ||||||||||
| 2,9959 | 2,56 | ||||||||||
Figure 11: Curves of flexural of the samples CN4 CN0.
3σ(MPa) = F/S ε = def2 - def1/def
As a reference, we mention that Li et al.[22] had performed the test of flexion in prismatic samples with dimensions of 4 cm x4 cm x16 cm (1.57 in x 1.57 in x 6.30 in) achieving a 25% increase in the flexural strength for mortars with content of 0.50% of carbon nanotube treated. Batiston[23], however, achieved results lower, with the largest value of around 5% for the same test and samples of same dimensions as that used by Li et al.[22] Batiston[23] justifies the difference in the result, due to the form factor of carbon nanotubes used, a fact that may have influenced the test results.
In general, there are factors that may contribute to the differentiation in the results, for example, the type of additive used, the form factor of the CNT, the methodology used in the manufacture of samples, the curing process the material, and so on. But, in all cases reported the insertion of CNT in cementitious composites resulted in improvement in their mechanical properties.
Microstructure
The porosity tests were performed for the different blends, at the age of 28 days. The results obtained on the percentage of pores and the apparent and relative densities of the samples are shown on Table 4.
Table 4: Test of porosity results (1 Kg = 2.2046 lb, 1 kg/m³ = 0.0624 lb/ft33).
| TEST OF POROSITY | ||||||
|---|---|---|---|---|---|---|
| Samples | Measurements | Results | ||||
| Hydro weight | Saturat weight | Dry Weight | Appar Dens | Relat Dens | Porosity | |
| CN0-S1 | 63,06 | 132,76 | 118,20 | 1,87 | 2,44 | 23,10 |
| CN0-S2 | 65,34 | 140,49 | 125,98 | 1,93 | 2,48 | 22,20 |
| Average | 64,20 | 136,63 | 122,09 | 1,90 | 2,46 | 22,65 |
| CN2-S1 | 55,96 | 120,02 | 107,53 | 1,92 | 2,47 | 22,30 |
| CN2-S2 | 85,73 | 185,44 | 165,96 | 1,94 | 2,51 | 22,70 |
| Average | 70,85 | 152,73 | 136,75 | 1,93 | 2,49 | 22,50 |
| CN4-S1 | 31,88 | 71,93 | 65,94 | 2,07 | 2,55 | 18,80 |
| CN4-S2 | 60,12 | 132,41 | 120,52 | 2,00 | 2,50 | 19,80 |
| Average | 46,00 | 102,17 | 93,23 | 2,04 | 2,52 | 19,30 |
| CN6-S1 | 39,64 | 83,42 | 74,15 | 1,87 | 2,44 | 23,40 |
| CN6-S1 | 60,53 | 127,71 | 113,02 | 1,87 | 2,47 | 24,30 |
The apparent density considers the effect of the pores and hence the amount of water contained in the sample volume, while the relative density excludes the influence of the water on the measuring process, and is therefore higher than the apparent density
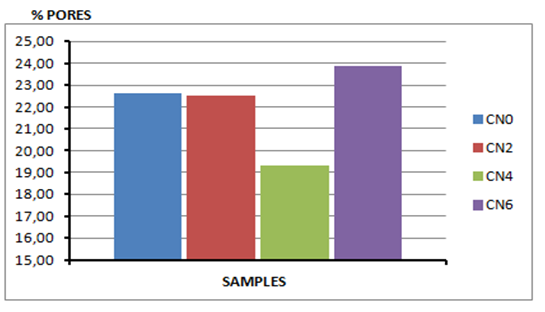
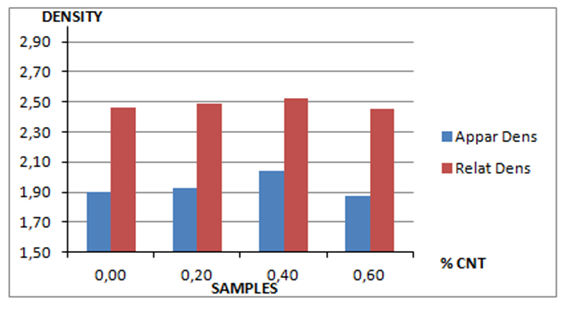
For a comparative view of the average values obtained from test of porosity, the figures 12 and 13 show respectively the variation of the percentage of pores, and of the densities, with addition of different amounts of carbon nanotubes in the mortar samples. The values of the relative density and of apparent density for the four samples were very close. However, the sample CN4[24-28] presented the largest values to both indicating a more dense structure, probably by the filling of pores and by the better interconnection between the grains of mixture, with the presence of the nanotube.
Figure 12: Variation of the mean values of the (%) of pores of the samples.
When evaluating the porosity of the samples, the CN4 blend also showed the better performance with a reduction of approximately 15% of pores, compared to the reference mixture CN0. This result leads us to understand that the composite with 0.4% of carbon nanotubes presents a denser structure, not only by filling the pores but also by the formation of more products from hydration, producing pores with diameters smaller. It is also observed that samples CN2 and CN6 did not show significant improvements in their microstructure, being that this last one, was till deteriorated, by inserting carbon nanotubes.
Figure 13: Variation of the mean values of the densities of the samples.
The decrease in the percentage of pores and the increase in the density of the mixture with insertion of nanotubes is a very positive factor for the durability of the concrete structures, since, with such a microstructure, the movement of aggressive agents within the material becomes more difficult.
Further Research
In order to improve the results of current research, it is suggested the replication of the methodology of this study, using other carbon nanotube contents; and the study of the behavior of cement composites with carbon nanotubes, at older ages to a wider knowledge of the performance of the new material over time.
It is still suggested further study of environmental impacts, and toxicity of new cementitious product, with nanotubes; and definition of handling standards, and protective equipment for professionals who work with nanomaterials.
Conclusion
Traditional materials in construction industry such as concrete, steel, asphalt, glass, etc., are used on a large scale, and produced in great quantities. To give just a example, cementitious materials exist for over 2000 years and currently more than two tons of concrete per person, on average, are used annually worldwide. Historically, the evaluation of the properties of these materials has only been possible in a macro scale. The understanding of behavior in nanoscale of the cement matrix and its interaction with other components used in the built environment can provide a powerful approach to develop concretes superiors, with better properties, and with more effective control of the degradation process.
Carbon nanotubes, when incorporated into cementitious materials have a remarkable characteristic: produce the best results by adding small percentages of nanotubes to composite. Moreover, they present a behavior that fits a Gaussian distribution, that is, it identifies a percentile range of CNT considered “ideal” for producing the best results; outside this range, the properties of the composites decay.
In the experiments reported in the present study, it was found that the mixture with the addition of 0.4% carbon nanotubes (CN4) resulted in a mortar with best performance compared to the reference sample, achieving an increase of approximately 40% the compression strength, 30% in tensile strength, 15% in flexural strength and a higher rate of structural compaction. The composites with addition of 0.2% and 0.6% CNT showed no significant results for these same characteristics.
Although it was expected that the performance of the tensile strength of the materials with nanotubes was higher than the compressive strength, considering that the CNT has excellent performance to tensile characteristic, the experiment showed that the sample had the most significant gains for the compressive strength, with the insertion of the CNT.
The mechanical properties investigated here, are the most used for understanding the cementitious materials and serve as a reference for measuring the quality of the mortar or concrete. Porosity testing was performed in order to obtain additional information about the microstructure of the new compounds, with the nanotubes.
It should be noted that this experience had a purely comparative basis, where the characteristics of the composites with nanotubes were compared with the equivalent characteristics of the pure mortar, without nanotube. Different results could be obtained, for the same phenomena investigated if altered, for example, material properties such as the type of the nanotube, type of additive, the sand grain size, etc. But we believe that the results in qualitative terms would be the same. The results derived from this research and from other studies in the literature leave no doubt of the benefits received by inserting carbon nanotubes in cementitious products. Besides the increments obtained on microstructure and mechanical properties of the composites, the use of nanomaterials in construction can represent savings and greater profitability in the enterprises, as well as a positive step toward preserving the environment, when using Portland cement in a more efficient and durable, in concrete structures.
Authors Biography
Jorge Fernandes de Morais is an Associated Professor at Telecommunication Department, Engineering School of Universidade Federal Fluminense, in Rio de Janeiro, Brazil. He received his BSc in Telecommunication Engineering from Universidade Federal Fluminense, in 1972; MSc in Electrical Engineering from Pontificia Universidade Catolica of Rio de Janeiro, in 2008 and PhD in Civil Engineering from Universidade Federal Fluminense together with Universitat Politecnica de Catalunya, Spain, in 2012. His doctoral thesis, entitled “Applications of Nanotechnologia in the Construction Industry”, was honored with two awards: in 2013, with the prize Ocar Niemeier, awarded by the Engineering Council of Rio de Janeiro, and in 2014 with the prize Dirceu de Alencar Velloso, awarded by the Association of Engineering Companies of Rio de Janeiro, ranked as the second best thesis of the year. Some of his research interest includes Nanotechnology applied in construction, effects of electromagnetic radiation in the environment, and sustainability. Assed N. Haddad is a Titular Professor at the Federal University of Rio de Janeiro, Rio de Janeiro, Brazil. He received his BSc and MSc in civil engineering from the Federal University of Rio de Janeiro, Rio de Janeiro, Brazil and Federal Fluminese University, Rio de Janeiro, in 1986 and 1992; and PhD in Production Engineering from the Federal University of Rio de Janeiro, Rio de Janeiro, in 1996. He is a senior member of American Society for Quality and hods ASQ CQE and CRE certifications. He received the ACI Wason Medal for Materials Research in 1988. His research interests include life cycle assessment and sustainability in construction.
Ana Catarina Jorge Evangelista is a titular Professor at the Federal University of Rio de Janeiro, Rio de Janeiro, RJ, Brazil. She received her BSc in civil engineering from the University of Amazon, Belem, PA, Brazil in 1992 and MSc and PhD in civil engineering at Federal University of Rio de Janeiro, Rio de Janeiro, RJ, Brazil, in 1996 and 2002, respectively. Her research interests include concrete technology, construction materials and sustainability in construction.
Acknowledge:
The authors would like to acknowledge financial support from Brazilian Government CAPES - Coordenacao de Aperfeicoamento de Pessoal de Nivel Superior (CAPES - BEX 6059/11-2) and CNPq Conselho Nacional de Desenvolvimento Cientifico e Tecnologico - “National Counsel of Technological and Scientific Development from Brazil” as well as, the Universitat Politecnica de Catalunya (UPC) by all the technical support provided for the experiment.
References
- 1. Addis B, Building: 3000 years of Design Engineering and Construction, Phaidon, 2007.
Pubmed || Crossref || Others - 2. Glapa Steven, A critical investor's guide to nanotechnology, Feb. 2002.
Pubmed || Crossref || Others - 3. Fava, C., Bergol, L., Fornasier, G., et al. Proceedings of the 3rd International RILEM Symposium on Self-Compacting Concrete. (2003) RILEM Publications S.A.R.L., Reykjavik 628–636.
Pubmed || Crossref || Others - 4. Husken, G., Brouwers, H. A new mix design concept for earth-moist concrete: a theoretical and experimental study. (2008) Cement and Concrete Research 38(10):1246– 1259.
Pubmed || Crossref || Others - 5. Sobolev, Konstantin. Modern developments related to nanotechnology and nanoengineering of concrete. (2016) Frontiers of Structural and Civil Engineering 10(2): 131–141.
Pubmed || Crossref || Others - 6. Morsy, M.S., Alsayed, S.H., Aqel, M. Hybrid effect of carbon nanotube and nano-clay on physico-mechanical properties of cement mortar. (2011) Construction and Building Materials 25(1): 145–149.
Pubmed || Crossref || Others - 7. Dong, S.R., Tu, J.P., Zhang, X.B. An Investigations of the sliding wear behavior of Cu-matrix composite reinforced by carbon nanotubes. (2001) Mater Sci Eng A 313(1-2): 83–87.
Pubmed || Crossref || Others - 8. Wagner, D., Lourie, O., Feldman, Y., et al. Stress induced fragmentation of multi-walled carbon nanotubes in a polymer matrix. (1998) Appl Phys Lett 72(2): 188-190.
Pubmed || Crossref || Others - 9. Makar, J.M., Margeson, J.C., Luh, J. Carbon nanotube and cement composites. (2005) Proceedings of 3rd International Conference on Construction Materials, Vancouver, 1–10.
Pubmed || Crossref || Others - 10. Agullo, V.J., Ligero, V.C., Rico, D.P., et al. " Mortar and Concrete Reinforced with Nanomaterials." (2009) Nanotechnology in Construction 3, 383-388.
Pubmed || Crossref || Others - 11. Balaguru P. and Chong, K, Nanotechnology and concrete: Nanotechnology of concrete: recent developments and future perspectives, American Concrete Institute, 2008. pags. 15-28.
Pubmed || Crossref || Others - 12. Li, Y., Wang, M., Zhao, X. Pressure-sensitive properties and microstructure of carbon nanotube reinforced cement composites. (2007) Cement and Concrete Composites 29(5): 377–382.
Pubmed || Crossref || Others - 13. Hunashyal, A.M., Tippa, S.V., Quadri., S.S. et al. “Experimental Investigation on Effect of Carbon Nanotubes and Carbon Fibers on the Behavior of Plain Cement Mortar Composite Round Bars under Direct Tension”. (2011) ISRN Nanotechnology, Article ID 856849, 6.
Pubmed || Crossref || Others - 14. Han, B., Yang, Z., Shi, X., et al. Transport Properties of Carbon-Nanotube/Cement Composites. (2013) Journal of Materials Engineering and Performance 22(1): 184-189.
Pubmed || Crossref || Others - 15. Manzur, T., Yazdani, N., Emon, M.A.B. Effect of Carbon Nanotube Size on Compressive Strengths of Nanotube Reinforced Cementitious Composites. (2014) Journal of Materials, Article ID 960984, 8.
Pubmed || Crossref || Others - 16. Lelusz, M.. Carbon Nanotubes Influence on the Compressive Strength of Cement Composites, Technical Transactions, Civil Engineering, 2014.
Pubmed || Crossref || Others - 17. Manzur, T., Yazdani, N. Optimum Mix Ratio for Carbon Nanotubes in Cement Mortar. (2015) KSCE Journal of Civil Engineering 19(5): 1405-1412.
Pubmed || Crossref || Others - 18. Campillo, I., Guerrero, A., Dolado, J.S., et al. Improvement of Initial Mechanical Strength by Nanoalumina in Belite Cements. (2007) Materials Letters 61(8-9): 1889-1892.
Pubmed || Crossref || Others - 19. Lai, C., Bassem, A. Finite element analysis of carbon nanotube/cement composite with degraded bond strength. 2010 ScienceDirect 47(4): 994-1004.
Pubmed || Crossref || Others - 20. Shah, Surendra, P., Hou, Pengkun., Konsta-Gdoutos, Maria, S. Nano-modification of cementitious material: toward a stronger and durable concrete. (2015) J Sustainable Cement-Based Materials 5(2): 1-22.
Pubmed || Crossref || Others - 21. Morais, J.F. Aplicacoes da Nanotecnologia na Industria da Construcao: Analise Experimental em Produtos Cimenticios com Nanotubos de Carbono, Tese de Doutorado. Universidade Federal Fluminense, Rio de Janeiro, Brasil, 2012.
Pubmed || Crossref || Others - 22. Li, Y., Wang, M., Zhao, X. Mechanical behavior and microstructure of cement composites incorporating surface-treated multi-walled carbon nanotubes. 2005 ScienceDirect 43(6): 1239-1245.
Pubmed || Crossref || Others - 23. Batiston R. Estudo exploratorio dos efeitos de nanotubos de carbono em matrizes de cimento Portland. (2007) Universidade Federal de Santa Catarina, Brazil.
Pubmed || Crossref || Others - 24. Montgomery DC. Introduction to Statistical Quality Control, 5th Edition. John Wiley & Sons Inc, 2005.
Pubmed || Crossref || Others - 25. Collins, F., Lambert, J., Duan, W.H. The influences of admixtures on the dispersion, workability and strength of carbon nanotube. (2012) Elsevier 34(2) 201-207.
Pubmed || Crossref || Others - 26. Gann D, A. Review of Nanotechnology and Its Potential Applications for Construction, University of Sussex, October 2002.
Pubmed || Crossref || Others - 27. Hu, Y., Shenderova, O.A., Hu Z., et al. Carbon nanostructures for advanced composites. (2006) Reports on Progress in Physics 69(6): 1847-1895.
Pubmed || Crossref || Others - 28. Li, H., Zhang, M.H., Ou, J.P. Flexural Fatigue Performance of Concrete Containing Nano particles for Pavement. (2007) International Journal of Fatigue 29(7): 1292-1301.
Pubmed || Crossref || Others


